For higher license levels, within Graph Options the Custom Filter option opens a menu into which formula arguments can be entered, enabling users to define what points should be plotted within the graphs, making it easier to assess points of interest.
Custom Filters are a very powerful tool to help define the exact points that are to be displayed within the various graphs.
Custom Filters
Custom Filters enable users to define exactly what measurement data to plot within the graphs, making it extremely easy to assess points of interest, both for direct assessment as well as for addition processing or to enable specific measurement to be re-measured, etc..
When Custom Filters are enabled, the Custom Filters button will show pale green.

The various ColourSpace specific Tokens that can be used are split into Constants & Functions, with the addition of standard Comparison & Logical Operators.
Constants
- R define the Red component of the points to be displayed using the input triplet, range 0.0-1.0
- G define the Green component of the points to be displayed using the input triplet, range 0.0-1.0
- B define the Blue component of the points to be displayed using the input triplet, range 0.0-1.0
- L define points to be displayed based on Luminance values, in absolute nits
- mY define the measured Y value of the points to be displayed
- mx define the measured x value of the points to be displayed
- my define the measured y value of the points to be displayed
- mu define the measured u value of the points to be displayed
- mv define the measured v value of the points to be displayed
- mX define the measured X value of the points to be displayed
- mZ define the measured Z value of the points to be displayed
- tY define the target Y value of the points to be displayed
- tx define the target x value of the points to be displayed
- ty define the target y value of the points to be displayed
- tu define the target u value of the points to be displayed
- tv define the target v value of the points to be displayed
- tX define the target X value of the points to be displayed
- tZ define the target Z value of the points to be displayed
- DE_1976 define the dE 1976 range for the points to be displayed
- DE_2000 define the dE 2000 range for the points to be displayed
- DE_ITP define the dE ITP range for the points to be displayed
- DE_LUV define the dE L*u*v* range for the points to be displayed
Functions
- GREY(R,G,B) display Grey Scale points
- PRI(R,G,B) display Primary Colour points
- SEC(R,G,B) display Secondary Colour points
- OTHERS(R,G,B) display points that are not Grey Scale, Primary or Secondary
- IN_TG display only the points within the Target colour space Gamut
Constants use operators to define their result (R > 0.5 to see all points with a R input triplet value greater than 0.5), while the Functions just return a fixed result if active (GREY(R.G.B) will show all the Grey Scale points). Combining Constants with Functions enables precise points selection, using the below Operators.
These Tokens can be used with standard programming operators (predominantly Comparison and Logical) to define the selection of points within the various graphs, including the following operators:
Comparison Operators
- == equal to
- != not equal to
- > greater than
- < less than
- >= greater than or equal to
- <= less than or equal to
Logical Operators
- && logical AND
- || logical OR
Other Operators
- () brackets, used to create groups and/or clarify the filter
- , comma, used to link filter items
In addition to the above basic Operators there are a large number of additional mathematical operators that can be used, as explained in the Advanced Mathematical Operation below.
Basic Custom Filter Operation
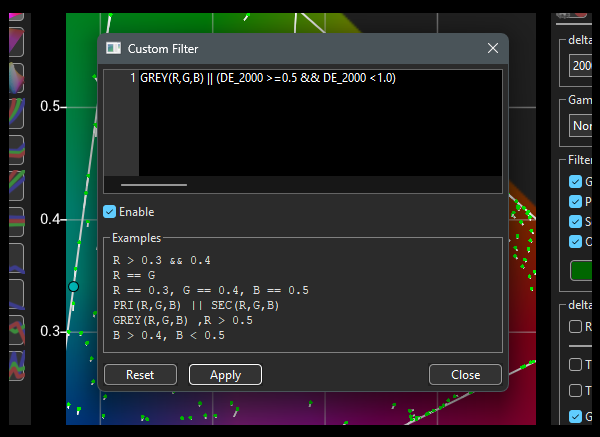
In the above Custom Filter image the pre-populated string is:
GREY(R,G,B) || (DE_2000 >= 0.5 && DE_2000 < 1.0)
In simple terms the string says it will show all points that are Grey Only, as well as all points that are within the Delta-E range 0.5 to 1.0 dE 2000.
The || operator specifies a logical OR operation, while the && operator specifies a logical AND operation, with >= specifying Greater than or equal to, and finally < specifying Less than.
With the above information is should be relatively easy to see that changing the || operator to && will change the graphs to show just the points that are within the Grey Scale and have a dE 2000 between 0.5 and 1.0.
GREY(R,G,B) && (DE_2000 >= 0.5 && DE_2000 < 1.0)
As a further example, using the following filter would show all Grey Scale and Primary Colour points that have values above 0.05, out of the range of 0-1 for the input patch triplet value.
GREY(R,G,B) || PRI(R,G,B), R > 0.05 || G > 0.05 || B > 0.05
And to add Secondaries:
GREY(R,G,B) || PRI(R,G,B) || SEC(R,G,B), R > 0.05 || G > 0.05 || B > 0.05
Another option would be to use the L (Luminance) token to define points within an absolute Luminance value range.
GREY(R,G,B) || PRI(R,G,B), L >= 10 && L <= 50
The above will show all Grey Scale and Primary Colour points that have Luminance values greater or equal to 10 nits, and less or equal to 50 nits.
And a useful simplification of the above is to show all points within a defined luminance range, as a slice through the 3D CIE graph.
L > 4 && L < 5
Which will show all points that have Luminance values greater than 4 nits, and less than 5 nits.
With more complex filters being possible, such as the following.
((R == G) && (R == B)) ||
((R > 0.9) && (R < 0.95) && (G == 0) && (B == 0)) ||
((R == 0) && (G > 0.9) && (G < 0.95) && (B == 0)) ||
((R == 0) && (G == 0) && (B > 0.9) && (B < 0.95))
Which will display all Grey Scale points, and RGB Primary points between 0.9 and 0.95.
(Which basically displays a Grey Ramp RGB Quick Profile from a volumetric profile)
And
(R == B) && (G == 1) ||
(R == G) && (B == 1) ||
(G == B) && (R == 1)
Which will display 100% stimulus levels Primary Gamut Sweeps.
Or
(R == B) ||
(R == G) ||
(G == B)
Which will display all stimulus levels for Primary & Secondary Gamut Sweeps.
(This is a very useful filter for a quick assessment of any display!)
And
(R == 0) && (G == 0) && (B > 0.85) && (B < 0.9) ||
(R == 0) && (G > 0.85) && (G < 0.9) && (B == 0) ||
(R == 0) && (G > 0.85) && (G < 0.9) && (B > 0.85) && (B < 0.9) ||
(R > 0.03) && (R < 0.04) && (G > 0.5) && (G < 0.55) && (B > 0.6) && (B < 0.65) ||
(R > 0.2) && (R < 0.25) && (G > 0.2) && (G < 0.25) && (B > 0.55) && (B < 0.6) ||
(R > 0.25) && (R < 0.3) && (G > 0.55) && (G < 0.6) && (B > 0.25) && (B < 0.3) ||
(R > 0.3) && (R < 0.35) && (G > 0.35) && (G < 0.4) && (B > 0.65) && (B < 0.7) ||
(R > 0.3) && (R < 0.35) && (G > 0.4) && (G < 0.45) && (B > 0.25) && (B < 0.3) ||
(R > 0.35) && (R < 0.4) && (G > 0.2) && (G < 0.25) && (B > 0.4) && (B < 0.45) ||
(R > 0.35) && (R < 0.4) && (G > 0.45) && (G < 0.5) && (B > 0.6) && (B < 0.65) ||
(R > 0.4) && (R < 0.45) && (G > 0.7) && (G < 0.75) && (B > 0.65) && (B < 0.7) ||
(R > 0.45) && (R < 0.5) && (G > 0.3) && (G < 0.35) && (B > 0.25) && (B < 0.3) ||
(R > 0.5) && (R < 0.55) && (G > 0.5) && (G < 0.55) && (B > 0.65) && (B < 0.7) ||
(R > 0.6) && (R < 0.65) && (G > 0.7) && (G < 0.75) && (B > 0.25) && (B < 0.3) ||
(R > 0.65) && (R < 0.7) && (G > 0.2) && (G < 0.25) && (B > 0.2) && (B < 0.25) ||
(R > 0.7) && (R < 0.75) && (G > 0.3) && (G < 0.35) && (B > 0.55) && (B < 0.6) ||
(R > 0.75) && (R < 0.8) && (G > 0.35) && (G < 0.4) && (B > 0.35) && (B < 0.4) ||
(R > 0.75) && (R < 0.8) && (G > 0.55) && (G < 0.6) && (B > 0.5) && (B < 0.55) ||
(R > 0.8) && (R < 0.85) && (G > 0.45) && (G < 0.5) && (B > 0.15) && (B < 0.2) ||
(R > 0.85) && (R < 0.9) && (G > 0.6) && (G < 0.65) && (B > 0.15) && (B < 0.2) ||
(R > 0.85) && (R < 0.9) && (G == 0) && (B == 0) ||
(R > 0.85) && (R < 0.9) && (G == 0) && (B > 0.85) && (B < 0.9) ||
(R > 0.85) && (R < 0.9) && (G > 0.85) && (G < 0.9) && (B == 0)||
(R > 0.9) && (R < 0.95) && (G > 0.75) && (G < 0.8) && (B < 0.1) && (B < 0.15)
Which will extract approx. Memory Colours from a volumetric profile, using an approximate range of 0.05 input stimulus. For different volumetric profiles different values/range would likely be required to encapsulate a point near a specific Memory Colour.
(Obviously, if an Add/Modify Points workflow is applied, as defined in the Profile Concatenation specific stimulus values can be used to target exactly the correct Memory Colours.)
And for profiles generated with a probe that struggled with low brightness measurements, you can remove just those points below a set nits value, but at the same time keep all Grey Scale and Primary measurements.
(
PRI(R,G,B)
||
GREY(R,G,B)
||
L >= 0.5
)
In the above filter all points that are NOT Grey Scale or Primary measurement are removed if they are below 0.5 nits.
Something similar could be used for WOLEDs, where as brightness increased the additional white pixel causes gamut reduction (actually gamy brightness stop increasing while the grey scale brightness continues to increase.
with such displays a filter can be generated to keep the grey scale points, but remove all colour points above a defined brightness vale. The correct value can be read from the RGB Separation graphs. In this case 100 nits
(
GREY(R,G,B)
||
(L <= 100)
)
It is worth saying that keeping Grey Scale measurements is not always necessary, nor even always the best for final grey scale calibration accuracy. And the same goes for Primary and Secondary measurement, especially with wide gamut displays. Often, using a Custom Filter to remove all gamut edge points can improve the final LUT and calibration.
The Custom Filters option also has associated functions linked to it, such as being able to Export patch selections as .csv lists and Save new profiles from within the Point Info window, and for use with Add/Modify Points within Characterisation.
Advanced Mathematical Operation
While the above are fairly obvious Custom Filter operation for general ColourSpace use, the Custom Filter option is far more powerful, as it can perform complex mathematical operations.
For more information on the various Operators available when defining the Custom Filtering see: Custom Filter Operators.
Such additional operators include addition, subtraction, multiplication, and much more.
Combining such mathematical operators with the ColourSpace specific Token enables complex filters to be defined, such as restricting the displayed points to a specific gamut range, in this case using the measured gamut values.
(
((mx - mxR)*(myG - myR) - (my - myR)*(mxG - mxR)) <= -0
&&
((mx - mxG)*(myB - myG) - (my - myG)*(mxB - mxG)) <= -0
&&
((mx - mxB)*(myR - myB) - (my - myB)*(mxR - mxB)) <= -0
)
Which will display only points with the defined measured x and y coordinates, as denoted by mxR, myR, and mxG, myG, and mxB, myB.
However, due to mathematical boundary conditions you may want to increase the defined gamut edge through the adjustment of the <= 0 value, such as <= -0.001.)
And if you wanted to see the points that are being excluded you can invert the formula.
(
((mx - mxR)*(myG - myR) - (my - myR)*(mxG - mxR)) >= -0.001
||
((mx - mxG)*(myB - myG) - (my - myG)*(mxB - mxG)) >= -0.001
||
((mx - mxB)*(myR - myB) - (my - myB)*(mxR - mxB)) >= -0.001
)
And you could perform a reduction in the gamut towards D65, rather than a generic shrink.
(
(( (0.3127 + 0.95*(mx - 0.3127)) - mxR )*(myG - myR)
- ((0.3290 + 0.95*(my - 0.3290)) - myR )*(mxG - mxR)
) <= -0.001
&&
(( (0.3127 + 0.95*(mx - 0.3127)) - mxG )*(myB - myG)
- ((0.3290 + 0.95*(my - 0.3290)) - myG )*(mxB - mxG)
) <= -0.001
&&
(( (0.3127 + 0.95*(mx - 0.3127)) - mxB )*(myR - myB)
- ((0.3290 + 0.95*(my - 0.3290)) - myB )*(mxR - mxB)
) <= -0.001
)
Such capabilities can be especially useful when combined with the Save selection function with the Point Info dialogue window, and become extremely powerful for accurate calibration of displays that require Reduced Gamut calibration due to bad pre-calibration that cannot be disabled.
As the Custom Filters use standard mathematical operators, combined with ColourSpace specific Token, AI assistants, such as Gemini and ChatGPT, can be used to help define mathematical formulas to use.
For example, I asked ChatGPT to generate a useful filter for ColourSpace using the available Tokens, and it suggested this:
(
PRI(R,G,B)
||
GREY(R,G,B)
||
L >= 0.1
)
Which ChatGPT stated as being a LUT Core Stability Filter, preserving measurement integrity for LUT generation, removing near-black noise and unstable shadow measurements.
And then suggested this as an improvement:
(
PRI(R,G,B)
||
GREY(R,G,B)
||
(L >= 0.12 && L <= 0.95)
)
Which ChatGPT defined as a shadow-safe OLED LUT filter, with near-black roll-off protection for OLEDs with near black measurement instability.
The possibilities really are basically endless...