ColourSpace has many options, tools, and capabilities for a range of colour workflow management, including display calibration, LUT conversion and manipulation, Look Management, and more.
This User Manual will help users understand what each button and function within ColourSpace does, and what options are associated with each function.

Minimise
The Minimise button will minimise the selected window, and any sub-windows.
Maximise
The Maximise button, when available, will maximise the selected window to full-screen.
Close
The Close button, will close the selected window, and any sub-windows.
Main Menu
The Main Menu is where all ColourSpace function windows are opened from, such as profiling and LUT management tools. Multiple windows of the same type can be opened, maximising colour management capabilities.

The keyboard Alt key will underline short-cut text keys, as shown under Tools, Preferences, and Help in the Main Menu image.
Selected Workflow
The Selected Workflow text box displays the presently selected workflow.
The Default workflow is always the last workflow active when ColourSpace was closed, enabling the last used parameters to be recalled quickly via the profiling button, without the need to pre-select a defined Workflow.
Tools
The Tools drop-down menu provides text-links that duplicate the icons within the Main Menu.

Preferences
The Preferences drop-down menu provides access to ColourSpace Preferences, presently Languages available for ColourSpace menus, and to set the native LUT Size used by higher level ColourSpace licenses.

Set Language
The Set Language option activates a drop-down list of all available languages for the ColourSpace menus.
Languages
The Available Languages drop-down lists all available languages for the ColourSpace menus.
Default language is the language the PC is set to.
Language translation files can be user generated. See the Foreign Languages page of the website for more information.
Theme
The Theme option enables the ColourSpace Theme to be defined by the user.
The options are Windows System default, Dark, and Light.
LUT Generation Size
With higher ColourSpace license levels the LUT Generation Size option enables the native LUT Size used within ColourSpace to be defined by the user.

The default LUT Size is 333. The user can define up to 10243 & beyond, based on the processing capabilities of the PC in use.
See the LUT Size information within the LUT Generation Size page of the website
Report Profile Count
With higher ColourSpace license levels the Reports Profile Count option sets the number of Profiles to be available for Reports, up to a maximum of 9.

Using multiple Profiles within Reports means different calibration information can be presented within a single Report that requires more than one profile, such as showing graphs for a Volumetric Profile, as well as Memory Colours, and Gamut Sweeps.
See the Report information within the Reports page of the website
Help
The Help drop-down menu provides text-links to the License and About windows.

License
The License menu provides the tools necessary for initial software Activation, as well as the ability to Reactivate if a license is updated, as well as Deactivate if moving ColourSpace to a different PC, where the license can be Activated again, for a maximum of 5 times.
Beyond 5 Deactivations, the form within the Licensing page of the website can be used to request additional license Deactivations.

About
The About window provides information on the present version of ColourSpace, including version number and release date.

Manage Spaces
The Manage Spaces library is where all preset colour spaces and profiles are held, and where all user modified colour spaces and profiles will be saved when generated.

The Column headings (Name, Created, and Type) can be used to reorder the main library sections, and each section can be expanded by single clicking the > more arrow icon, or double clicking a specific library section.
When expanded, each section lists all the available Colour Spaces, Camera Spaces, Profiles, and LUTs, both preset and user generated, depending on the options available with the ColourSpace license in use.
Name
The Name header will order all library entries in name order - ascending/descending, depending on the number of times it is clicked.
Created
The Created header will order all library entries in date order - ascending/descending, depending on the number of times it is clicked.
Type
The Type header will order all library entries in date file type - ascending/descending, depending on the number of times it is clicked.
Depending on the selected Library entries, the Type information will include data specific to the Colour Space, Profile, or Camera Space.
Colour Spaces (preset)
- Preset Matrix - Standard colour space, power law EOTF
- Preset Encoding - Video encoding, for use with camera spaces
- Preset BT1886 - Standard colour space with variable BT1886 EOTF
- Preset DCI Scaling - Scales white point to prevent channel clipping for DCI use
- Preset SMPTE 2084 - Default PQ EOTF
- Preset HLG - Default BBC HLG EOTF
- Preset Philips HDR 5k - Default Philips EOTF 5,000 nits
- Preset Philips HDR 10k - Default Philips EOTF 10,000 nits
- Preset Eclair - Default Eclair EOTF
- Preset ACES2065-1 - Default ACES
- Preset ACEScg - ACEScg EOTF & Gamut
- Preset ACESproxy - ACESproxy EOTF & Gamut
- Preset ACEScc - ACEScc EOTF & Gamut
- Preset ACEScct - ACEScct EOTF & Gamut
- Preset Dicom - Medical JND EOTF
Camera Spaces (preset)
- Preset Camera Rec709 - Default Rec709 camera
- Preset Camera ARRI Alexa - Default ARRI Alexa camera
- Preset Camera Blackmagic - Default Blackmagic camera
- Preset Camera Canon - Default Canon Camera
- Preset Camera DJI - Default DJI camera
- Preset Camera Panasonic - Default Panasonic camera
- Preset Camera Red - Default Red camera
- Preset Camera Sony - Default Sony camera
Profiles (presets)
- Preset Profile - Default film profile
Colour Spaces (user)
Additional Type data added to default Colour Spaces when modified
- XXX pGamma points - Parametric Gamma, with XXX points
- x XX.X - PQ EOTF with Projector Multiplier
- BT - PQ EOTF with BT.2390-3 Tone mapping
- BT x XX.X - PQ EOTF with BT.2390-3 Tone mapping and Projector Multiplier
- SR - PQ EOTF with Soft Roll Off Tone mapping
- SR x XX.X - PQ EOTF with BT.2390-3 Tone mapping and Projector Multiplier
Profiles (user)
Specific Type data for user generated profiles
- Profile - Cube based of any size
- Grey Ramp RGB - Quick Profile of a grey ramp with single RGB patches
- Grey Ramp RGBCMY+ - Quick Profile of a grey ramp with single RGBCMY patches
(Enables Multi Primary Colour Engine) - Grey & Primary Ramp - Quick Profile of a grey and RGB ramps
- Grey Primary & Secondary Ramp+ - Quick Profile of a grey and RGBCMY ramps
(Enables Multi Primary Colour Engine) - Memory Colours - Quick Profile of a grey ramp with memory colours, plus single RGB or RGBCMY patches
- Gamut Sweep - Quick Profile of a grey ramp with 75% or 100% Primary or Primary & Secondary gamut sweeps
- Edge Sweep - Quick Profile of a grey ramp and gamut edges
Additional Type data added to above profile types
- Legal/Extended (Full is the default so not noted)
- Bit depth
- :Aug - Profile has additional Augment data included
- :Drift - Profile has Drift data included
- :Matched - Profiles was saved with Probe Matching active
- ... - Profile is an old format and should be re-saved to update
Colour Spaces (preset)
The Colour Spaces (preset) section, when expanded, shows all the in-built colour spaces within ColourSpace.
Some colour spaces, such as Video Encode, will only be available with certain ColourSpace license levels.
")
The Import Space button opens a navigation windows to allow external colour spaces to be imported, while the Export button allows any presently selected colour spaces to be exported.
(Ctrl + Left Click allows the selection of multiple items.)
Modify enables the generation of a new (user) colour space, based on the initial values of the selected preset colour space - Rec709 with a gamma 2.35 for example, with saved changes propagating throughout ColourSpace.
Modify is specifically used with HDR and HLG colour spaces to define display specific peak luma values and tone mapping/roll off.
Click the buttons within the main Manages Spaces library image for more information.
Camera Spaces (preset)
The Camera Spaces (preset) section, when expanded, shows all the in-built camera colour spaces within ColourSpace, if the license in use has the Cameras option.
")
The Import Space button opens a navigation window to allow external camera spaces to be imported, while the Export button allows any presently selected camera colour spaces to be exported.
(Ctrl + Left Click allows the selection of multiple items.)
Modify enables the generation of a new (user) camera colour space, based on the initial values of the selected camera preset.
Modify is specifically used to alter camera settings, such as transfer function, gamut, tone mapping, clip levels, etc.
Click the buttons within the main Manages Spaces library image for more information.
See the Camera Options page for more information.
Profiles (preset)
The Profiles (preset) section, when expanded, shows the in-built film stock profiles.
")
The Import Space button opens a navigation window to allow external (user) profiles to be imported.
Display enables the selected profile to be opened within the Profiling window, so the graphs can be used to visually assess the film stock profile data.
(Ctrl + Left Click allows the selection of multiple items.)
Click the buttons within the main Manages Spaces library image for more information.
Colour Spaces (user)
The Colour Spaces (user) section, when expanded, shows any user generated colour spaces within ColourSpace.
User colour spaces are generated by selecting any existing colour space - preset or user - and using Modify.
")
The Import Space button opens a navigation window to external colour spaces to be imported, while the Export button allows any presently selected colour spaces to be exported.
(Ctrl + Left Click allows the selection of multiple items.)
Modify enables the generation of a new (user) colour space, based on the initial values of the selected preset colour space - Rec709 with a gamma 2.35 for example, with saved changes propagating throughout ColourSpace.
Modify is specifically used with HDR and HLG colour spaces to define display specific peak luma values.
Click the buttons within the main Manages Spaces library image for more information.
Camera Spaces (user)
The Camera Spaces (user) section, when expanded, shows any user generated camera colour spaces within ColourSpace, if the license in use has the Cameras option.
")
The Import Space button opens a navigation window to allow external camera spaces to be imported, while the Export button allows any presently selected camera colour spaces to be exported.
(Ctrl + Left Click allows the selection of multiple items.)
Modify enables the generation of a new camera colour space, based on the initial values of the selected camera colour space.
Modify is specifically used to alter camera settings, such as transfer function, gamut, tone mapping, clip levels, etc.
Click the buttons within the main Manages Spaces library image for more information.
See the Camera Options page for more information.
Profiles (user)
The Profiles (user) section, when expanded, shows any user generated profiles held within ColourSpace.
")
There are 6 different icons for different profile types.
 Volumetric Profile
 Grey Ramp RGB(CMY+)
 Grey & Primary Ramp (& Secondary+)
 Memory Colours
 Gamut Sweep
 Edge Sweep
Profiles are loaded on demand, with profile metadata shown to the right of the profile, within the Type column.
Any Profiles where three dots [...] are shown is an older Profile format, and should be opened and re-Saved to update it.
Each profile will have Name, Date, and Type information, plus associated metadata:
- :nn Bits - the bit depth Resolution used when generating the profile
- :Lim nnnCV - the Limit Range Code Value set when generating the profile
- :Aug - the profile is Augmented with a different grey scale profile
- :Drift - means Drift patches are included in the profile
- :Matched - the profile was saved with a Probe Match enabled
The Import Space button opens a navigation window to allow external profiles to be imported.
The Export button allows any presently selected profiles to be exported, including as a Matrix if available, via the Save as type options available after the Export button has been clicked.
Display enables the selected profile to be opened within the Profiling window, so the graphs can be used to visually assess the profile, as well edit/modify points, and save as a new profile.
(Ctrl + Left Click allows the selection of multiple items.)
Click the buttons within the main Manages Spaces library image for more information.
Working LUTs
The Working LUTs section, when expanded, shows any LUTs temporarily held within ColourSpace.
(LUTs are only temporarily held within ColourSpace while being worked on, and are cleared when ColourSpace is closed, other than the Default Unity LUT.)

The Import LUT button opens a navigation window to allow external LUTs to be imported, while the Export button allows any presently selected LUT to be exported, based on the LUT format and type selected from the two drop-down lists, including as a Config File where available.
Display enables the selected LUT to be opened within the LUT Tools window, so the LUT graphs can be used to visually assess the LUT, as well as modify the LUT with the provided LUT Manipulation tools, LUT concatenation, etc., and save as a new LUT.
(Ctrl + Left Click allows the selection of multiple items.)
Click the buttons within the main Manages Spaces library image for more information.
Import Space
The Import Space button opens a navigation window to allow external colour spaces, profiles, and camera spaces to be imported.
Import LUT
The Import LUT button opens a navigation window to allow external LUTs to be imported.
LUTs can be imported in the available LUT file formats, or as ColourSpace LUT Images.
When a LUT is imported it is converted into the native LUT size within ColourSpace, which by default is 333.
With higher ColourSpace license levels the LUT size can be set to any size up to 10243 and beyond. The size needs to be set before a LUT is imported via Preferences.
Export
The Export button enables any selected colour spaces, camera spaces, profiles and LUTs to be exported.
(Multiple items can be selected simultaneously using Ctrl + Left Click.)
Display
The Display button enables any selected profiles or LUTs to be opened using the Profiling or LUT Tools windows, and displayed using the available graphs. Any displayed profile can also have points edited, re-measured, or probe matching applied, while LUTs can also have points edited, or be manipulated using the available LUT Manipulation tools, with the new profile or LUT saved back into the library.
(Multiple items can be selected simultaneously using Ctrl + Left Click.)
Delete
The Delete button enables any selected colour spaces, camera spaces, profiles and LUTs to be deleted.
(Multiple items can be selected simultaneously using Ctrl + Left Click and all selected items immediately deleted via Ctrl + Delete.)
The keyboard Del key can also be used, including Ctrl + Del to immediately delete all selected items.
LUT Export (type)
The LUT Export (type) drop-down list enables selection of the LUT type to be exported - predominantly the display/LUT box the LUT is to be used with, if the display/LUT box is not directly integrated into the Hardware Options of ColourSpace.
")
After the LUT Type is selected, the second LUT Type drop-down can be used to set the correct file format.
Note: If the LUT Type or Format is not immediately available as a default option, check if the export format is available by first importing a LUT of the correct type. If a LUT can be imported, there is a matching export option, but it may be under a different name. For example, within BMD there is no 173 .cube format, but the format exists as the AJA LUT export format.
LUT Export (format)
The LUT Export (format) drop-down list enables desired format of the selected type to be defined.
")
After the LUT Format is selected, the LUT can be exported via the Export button.
Note: If the LUT Type or Format is not immediately available as a default option, check if the export format is available by first importing a LUT of the correct type. If a LUT can be imported, there is a matching export option, but it may be under a different name. For example, within BMD there is no 173 .cube format, but the format exists as the AJA LUT export format.
Modify
The Modify option opens different windows, with different options, depending on the Colour Space, Camera Space, or Profile selected.
(Click each of the Blue highlighted space options to see the different Modify options )
The tools available via Modify are key to ColourSpace operation, as they provide advanced user control and flexibility.
The Modify windows remains open after a Save has been performed to enable multiple changes to be saved.
Importantly, changes to colour spaces are live, and propagate throughout ColourSpace, meaning changes can be immediately seen within the various Profiling graphs.

Video Encode
The Modify Video Encode option enables different Video Encode colour spaces to be generated, and saved as a new Colour Space (user).
Video Encode colour space is a special colour space, used with the Camera Options, to map camera data into video space, managing the compound encoding gamma used in video signals.

Any of the colour space parameters can be user adjusted, and a new user colour space saved.
Colour Space Matrix
The Modify Matrix options enable new standard colour spaces to be generated, and saved as a new Colour Space (user).
The standard Matrix colour space included Rec709, P3, Rec2020, sRGB, BT1886, DCI Scaling, Philips, Eclair, ACES, and DICOM. The differences are the Transfer Functions (EOTF) used, which are defined by the different colour spaces.

Any of the colour space parameters can be user adjusted, and a new user colour space saved.
ST2084
The Modify ST2084 option enables new ST2084 colour spaces to be generated, targeting different peak luma values, with different tone mapping/roll-off as required, and saved as a new Colour Space (user).
Any of the colour space parameters within the top section can be user adjusted, and a new user colour space saved, including setting the required target peak luma Nits value.
When using a hard clip, the Nits value should be set below the display's actual peak, and and be a standard target value, such as 1000 nits, 1200 nits, although the Update button can be used to extract the peak luma value for a selected profile as a starting point.
The Soft Roll Off and Tone Mapping options should NOT be used for grading displays.

The Target Profile option can be used to load an existing display profile, enabling the Nits value, and Target Min/Max values within Soft Roll Off & BT.2390 Tone Mapping, to be set automatically via the Update buttons.
Note: The actual peak luma value extracted from a Target Profile should not be used directly, but used as a starting point to help define the correct value to use.
The Soft Roll Off and Tone Mapping options enable displays with a peak luma lower than the master display to roll-off highlight detail, as required.
The Mastering Min/Max values should be set to match the grading/mastering display, while the Target Min/Max values should be set to the values defined by the display being calibrated, using the Target Profile data as a starting point for the peak luma value.
Within Soft Roll Off the Target upper start % options defines the level at which highlight roll-off starts, while Target lower start % defines the level at which shadow roll-off starts.
BT.2390 Tone Mapping has roll-off defined by the Mapping option presets drop-down.
The Multiplier (projection HDR) value box enables the effective peak Nits value of a projector (or any other display) to be treated as being higher, based on the multiplier value. The value can be set manually, or via the Update box, which will extract the value from a Target Profile, and set the Multiplier automatically.
For example, a 100 nits peak projector can be treated as a 1000 nits display, using a multiplier of x10, by setting the top Nits value to 1000, and setting Effective Max (nits) value to the projector's actual peak of 100 nits, either manually, or via the Effective Max (nits) Update button, both of which which will set the Multiplier value to 10.
The Output name text box enables a new user ST2084 colour space to be named and saved.
Note: When using any ST2084 profile to generate a HDR LUT the Max Limit Luminance option within LUT Generation should be set to the same Peak Luma value as the target ST2084 colour space, to maintain the correct absolute luma tracking of the ST2084 standard.
HLG
The Modify HLG option enables new HLG colour spaces to be generated, targeting different peak luma with different surround illumination values as required, and saved as a new Colour Space (user).

The Target Profile option can be used to load a display profile, to enable Peak Luma values to be set automatically via the Update buttons.
System Gamma can de set manually, or calculated from the Peak and Surround Luma values, via the Calc EOTF button.
Any of the colour space parameters can be user adjusted, and a new user colour space saved.
Camera
The Modify Camera option enables the generation of new user camera spaces, defining the parameters to be used when generating Look and Technical LUTs via the LUT Tools menu.
All of the included cameras have similar options, based on the specific camera properties, as defined by the relevant manufacturer.

Any of the camera space parameters can be user adjusted, and a new user camera space saved.
See the Camera Options page for more information.
Profiles
The Modify Profiles option enables specific functions to be performed on the selected display profile.

Extract Space will extract a colour space from the select profile, which can be used to map the profile to itself to assess underlying display issues.
Extract BPD will convert the selected profile into a Probe Matching file for MPVM use.
Add Aug will open a drop-down selection list to enable another profile to be added as Augment Data (for example, a large Grey Ramp profile added to a 103 profile, to enhance grey scale accuracy during LUT generation).
Del Aug will enable an added Augment Data file to be deleted from the selected profile, if it has one.
Concatenate enables two different profiles to be concatenated, with patches already within the existing profile being overwritten by the patch values in the second profile, and new patch values in the second profile being added to the first.
Depending on the selected function, a new colour space, profile, or probe match file will be saved.
Profiling
The Profiling window provides access to all tools associated with display measurement, including integration with probes and additional hardware, such as displays, LUT Boxes, and TPGs.
(Back to Main Menu)
Settings
The Profiling window initially opens on Settings, where general configurations used throughout the Profiling window can be defined.

Profile & Workflow Name
The Profile Name shows the loaded profile, or profile being measured, with a * at the end of the name denoting changes have not been saved.
[D] and [M] shown before the profile name indicates the graphs are being plotted with Drift and/or Probe Matching active.
The Workflow Name shows the selected Workflow, defining ColourSpace configuration settings, such as Bit Depth, Patch Scale & Resolution, selected Probe, connected Hardware, etc.
If the Default Workflow is selected and active, no Workflow name is displayed.
CIE xy Graph
The CIE xy icon button selects the CIE xy graph within the main Profiling window.
Using Ctrl + CIE xy icon button will pop-out floating CIE xy graphs each time the combination is pressed. Each can be zoomed and pan & scanned, as well as positioned independently.
Left Click enables pan & scan, and Right Click enables zoom.
Zoom can also be controlled via a mouse scroll wheel and two finger touchpad.
Double Right Click resets the graph.


The screen position of each pop-out floating graph will be remembered when ColourSpace is closed, and re-opened in the same order/position as well as internal zoom & position.
When the mouse is hovered over the graph a  Graph Options Hamburger button will appear, and provides access to graph specific options, such as for Point Adjust and Absolute plotting.

Double Left Click on any point in the graph opens a floating Point Info window enabling any point to be edited, deleted, or the selected patches exported as a .csv list.
Note: If Probe Matching is active points cannot be edited either via Point Adjust or via the Point Info window.

The Display Selection drop-down enables the points list to show all profile points, the selected point, and points presently selected to be displayed via the Graph Options window, Filters option.
(The data within the Point Info dialogue is also constrained by the Patch Scale value setting, and Patch Scale should be set to match the values used when the profile was generated.)
The Export selection option will export a .csv list of the selected points, and can be used to export specific patches, such as for use with Extended Probe Dynamic Range.
The Save selection option will save the selected points as a new Profile, enabling alternate profiles to be saved as a sub-set of the original profile.
A Double Left Click on any point in the graph also set the patch colour, and sliders in Manual Measure, to the colour of the selected point, enabling individual points to be re-measured as required.
If the Show/Enable Point move options have been enabled via additional Graph Options, a Double Left Click on any point in the graph selects the point, and opens a floating values window. After a point has been selected, hovering over it will display Point Adjust arrows, enabling the selected point to be manually adjusted, as well as allowing the values in the floating window to be directly edited.
As a point is adjusted, a yellow Tangent Line will show the deviation from the point's original location. Reset and Apply buttons also become enabled when a point has been repositioned.
If multiple points are adjusted, but not Applied, the point's dot marker will be shown larger than normal to signify an adjustment has been made. All individual adjusted points need to be Applied before the profile is Saved.
Note: When Apply is actioned is is likely other components with the graph will change, due to value interaction, as well as affecting other graphs, such as changes to RGB Balance altering EOTF.
Any changes to a point are mapped live across all associated graphs, such that changes to grey scale points made in the CIE graphs will be mirrored within the associated RGB Balance, EOTF, RGB Separation graphs, etc. Using the pop-out floating graphs capability means all associated graphs can be viewed simultaneously while making Point Adjust changes.
Repeated double clicking of a given point will cycle through all three RGB colours, should they all have the same coordinates, and will bring to the front the selected colour channel's graph line in 1D graphs.

The floating Point Adjust values window can be repositioned using the floating window's top bar, and if placed back over its active point will re-dock back to its default location.
CIE uv Graph
The CIE uv icon button selects the CIE uv graph within the main Profiling window.
Using Ctrl + CIE uv icon button will pop-out floating CIE uv graphs each time the combination is pressed. Each can be zoomed and pan & scanned, as well as positioned independently.
Left Click enables pan & scan, and Right Click enables zoom.
Zoom can also be controlled via a mouse scroll wheel and two finger touchpad.
Double Right Click resets the graph.


The screen position of each pop-out floating graph will be remembered when ColourSpace is closed, and re-opened in the same order/position as well as internal zoom & position.
When the mouse is hovered over the graph a Graph Options Hamburger button will appear, and provides access to graph specific options, such as for Point Adjust and Absolute plotting.
Double Left Click on any point in the graph opens a floating Point Info window enabling any point to be edited, deleted, or the selected patches exported as a .csv list.
Note: If Probe Matching is active points cannot be edited either via Point Adjust or via the Point Info window.
The Display Selection drop-down enables the points list to show all profile points, the selected point, and points presently selected to be displayed via the Graph Options window, Filters option.
(The data within the Point Info dialogue is also constrained by the Patch Scale value setting, and Patch Scale should be set to match the values used when the profile was generated.)
The Export selection option will export a .csv list of the selected points, and can be used to export specific patches, such as for use with Extended Probe Dynamic Range.
The Save selection option will save the selected points as a new Profile, enabling alternate profiles to be saved as a sub-set of the original profile.
A Double Left Click on any point in the graph also set the patch colour, and sliders in Manual Measure, to the colour of the selected point, enabling individual points to be re-measured as required.
If the Show/Enable Point move options have been enabled via additional Graph Options, a Double Left Click on any point in the graph selects the point, and opens a floating values window. After a point has been selected, hovering over it will display Point Adjust arrows, enabling the selected point to be manually adjusted, as well as allowing the values in the floating window to be directly edited.
As a point is adjusted, a yellow Tangent Line will show the deviation from the point's original location. Reset and Apply buttons also become enabled when a point has been repositioned.
If multiple points are adjusted, but not Applied, the point's dot marker will be shown larger than normal to signify an adjustment has been made. All individual adjusted points need to be Applied before the profile is Saved.
Note: When Apply is actioned is is likely other components with the graph will change, due to value interaction, as well as affecting other graphs, such as changes to RGB Balance altering EOTF.
Any changes to a point are mapped live across all associated graphs, such that changes to grey scale points made in the CIE graphs will be mirrored within the associated RGB Balance, EOTF, RGB Separation graphs, etc. Using the pop-out floating graphs capability means all associated graphs can be viewed simultaneously while making Point Adjust changes.
Repeated double clicking of a given point will cycle through all three RGB colours, should they all have the same coordinates, and will bring to the front the selected colour channel's graph line in 1D graphs.

The floating Point Adjust values window can be repositioned using the floating window's top bar, and if placed back over its active point will re-dock back to its default location.
3D Graph
The 3D Graphs icon button selects the 3D graphs within the main Profiling window.
The type of 3D Graph displayed can be defined by the Graphs Options window, 3D Graphs drop-down list, selecting 3D xyY, 3D uvY, RGB Cube, and XYZ Cube.
Note: The Cube graphs cannot plot negative data - negative points collapse to zero
Using Ctrl + 3D Graphs icon button will pop-out floating 3D graphs each time the combination is pressed. Each can be zoomed, rotated and pan & scanned, as well as positioned independently.
Left Click enables rotation, Right Click enables zoom, and Crtl + Right Click enables position.
Double Right Click resets the graphs.


The screen position of each pop-out floating graph will be remembered when ColourSpace is closed, and re-opened in the same order/position as well as internal zoom & position.
Double Left Click on any point in the graph opens a floating Point Info window enabling any point to be edited, deleted, or the selected patches exported as a .csv list.
Note: If Probe Matching is active points cannot be edited either via Point Adjust or via the Point Info window.
The Display Selection drop-down enables the points list to show all profile points, the selected point, and points presently selected to be displayed via the Graph Options window, Filters option.
(The data within the Point Info dialogue is also constrained by the Patch Scale value setting, and Patch Scale should be set to match the values used when the profile was generated.)
The Export selection option will export a .csv list of the selected points, and can be used to export specific patches, such as for use with Extended Probe Dynamic Range.
The Save selection option will save the selected points as a new Profile, enabling alternate profiles to be saved as a sub-set of the original profile.
A Double Left Click on any point in the graph also set the patch colour, and sliders in Manual Measure, to the colour of the selected point, enabling individual points to be re-measured as required.
EOTF Graph
The EOTF icon button selects the EOTF graph within the main Profiling window.
The graphs plots both EOTF and Luma errors.
Using Ctrl + EOTF icon button will pop-out floating EOTF graphs each time the combination is pressed. Each can be zoomed and pan & scanned, as well as positioned independently.
Left Click enables pan & scan, and Right Click enables zoom.
Zoom can also be controlled via a mouse scroll wheel and two finger touchpad.
Double Right Click resets the graph.


The screen position of each pop-out floating graph will be remembered when ColourSpace is closed, and re-opened in the same order/position as well as internal zoom & position.
When the mouse is hovered over the graph a Graph Options Hamburger button will appear, and provides access to graph specific options, such as for Point Adjust and Absolute plotting, which will alter the graph to plot the absolute luma error, relative to the Target Min/Max values.
Double Left Click on any point in the graph opens a floating Point Info window enabling any point to be edited, deleted, or the selected patches exported as a .csv list.
Note: If Probe Matching is active points cannot be edited either via Point Adjust or via the Point Info window.
The Display Selection drop-down enables the points list to show all profile points, the selected point, and points presently selected to be displayed via the Graph Options window, Filters option.
(The data within the Point Info dialogue is also constrained by the Patch Scale value setting, and Patch Scale should be set to match the values used when the profile was generated.)
The Export selection option will export a .csv list of the selected points, and can be used to export specific patches, such as for use with Extended Probe Dynamic Range.
The Save selection option will save the selected points as a new Profile, enabling alternate profiles to be saved as a sub-set of the original profile.
A Double Left Click on any point in the graph also set the patch colour, and sliders in Manual Measure, to the colour of the selected point, enabling individual points to be re-measured as required.
If the Show/Enable Point move options have been enabled via additional Graph Options, a Double Left Click on any point in the graph selects the point, and opens a floating values window. After a point has been selected, hovering over it will display Point Adjust arrows, enabling the selected point to be manually adjusted, as well as allowing the values in the floating window to be directly edited.
As a point is adjusted, a yellow Tangent Line will show the deviation from the point's original location. Reset and Apply buttons also become enabled when a point has been repositioned.
If multiple points are adjusted, but not Applied, the point's dot marker will be shown larger than normal to signify an adjustment has been made. All individual adjusted points need to be Applied before the profile is Saved.
Note: When Apply is actioned is is likely other components with the graph will change, due to value interaction, as well as affecting other graphs, such as changes to RGB Balance altering EOTF.
Any changes to a point are mapped live across all associated graphs, such that changes to grey scale points made in the CIE graphs will be mirrored within the associated RGB Balance, EOTF, RGB Separation graphs, etc. Using the pop-out floating graphs capability means all associated graphs can be viewed simultaneously while making Point Adjust changes.
Repeated double clicking of a given point will cycle through all three RGB colours, should they all have the same coordinates, and will bring to the front the selected colour channel's graph line in 1D graphs.

The floating Point Adjust values window can be repositioned using the floating window's top bar, and if placed back over its active point will re-dock back to its default location.
Dif EOTF Graph
The Dif EOTF icon button selects the Dif EOTF graph within the main Profiling window.
When the mouse is hovered over the graph a Graph Options Hamburger button will appear, and provides access to graph specific options, such as for Point Adjust and Absolute plotting, which will alter the graph to plot the absolute luma error, relative to the Target Min/Max values, in stops.
Using Ctrl + Dif EOTF icon button will pop-out floating Dif EOTF graphs each time the combination is pressed. Each can be zoomed and pan & scanned, as well as positioned independently.
Left Click enables pan & scan, and Right Click enables zoom.
Zoom can also be controlled via a mouse scroll wheel and two finger touchpad.
Double Right Click resets the graph.


The Dif EOTF graph show the difference in the measured EOTF from the target colour space EOTF, with the 0.0 graph line representing the selected target colour space EOTf, be that power law 2.4, BT1886, HLG, ST2084, etc.
The screen position of each pop-out floating graph will be remembered when ColourSpace is closed, and re-opened in the same order/position as well as internal zoom & position.
When the mouse is hovered over the graph a Graph Options Hamburger button will appear, and provides access to graph specific options, such as for Point Adjust and Absolute plotting.
Double Left Click on any point in the graph opens a floating Point Info window enabling any point to be edited, deleted, or the selected patches exported as a .csv list.
Note: If Probe Matching is active points cannot be edited either via Point Adjust or via the Point Info window.
The Display Selection drop-down enables the points list to show all profile points, the selected point, and points presently selected to be displayed via the Graph Options window, Filters option.
(The data within the Point Info dialogue is also constrained by the Patch Scale value setting, and Patch Scale should be set to match the values used when the profile was generated.)
The Export selection option will export a .csv list of the selected points, and can be used to export specific patches, such as for use with Extended Probe Dynamic Range.
The Save selection option will save the selected points as a new Profile, enabling alternate profiles to be saved as a sub-set of the original profile.
A Double Left Click on any point in the graph also set the patch colour, and sliders in Manual Measure, to the colour of the selected point, enabling individual points to be re-measured as required.
If the Show/Enable Point move options have been enabled via additional Graph Options, a Double Left Click on any point in the graph selects the point, and opens a floating values window. After a point has been selected, hovering over it will display Point Adjust arrows, enabling the selected point to be manually adjusted, as well as allowing the values in the floating window to be directly edited.
As a point is adjusted, a yellow Tangent Line will show the deviation from the point's original location. Reset and Apply buttons also become enabled when a point has been repositioned.
If multiple points are adjusted, but not Applied, the point's dot marker will be shown larger than normal to signify an adjustment has been made. All individual adjusted points need to be Applied before the profile is Saved.
Note: When Apply is actioned is is likely other components with the graph will change, due to value interaction, as well as affecting other graphs, such as changes to RGB Balance altering EOTF.
Any changes to a point are mapped live across all associated graphs, such that changes to grey scale points made in the CIE graphs will be mirrored within the associated RGB Balance, EOTF, RGB Separation graphs, etc. Using the pop-out floating graphs capability means all associated graphs can be viewed simultaneously while making Point Adjust changes.
Repeated double clicking of a given point will cycle through all three RGB colours, should they all have the same coordinates, and will bring to the front the selected colour channel's graph line in 1D graphs.
The floating Point Adjust values window can be repositioned using the floating window's top bar, and if placed back over its active point will re-dock back to its default location.
RGB Separation Graph
The RGB Separation icon button selects the RGB Separation graph within the main Profiling window.
Using Ctrl + RGB Separation icon button will pop-out floating RGB Separation graphs each time the combination is pressed. Each can be zoomed and pan & scanned, as well as positioned independently.
Left Click enables pan & scan, and Right Click enables zoom.
Zoom can also be controlled via a mouse scroll wheel and two finger touchpad.
Double Right Click resets the graph.


The RGB Separation graph shows the individual RGB channels compared to the grey scale, with a poor graph showing display cross-coupling errors or grey scale errors.
For the RGB Separation graph to plot and make valid sense the profile must have the same patches within the Primary RGB patch sequences as within the Grey sequence.
The screen position of each pop-out floating graph will be remembered when ColourSpace is closed, and re-opened in the same order/position as well as internal zoom & position.
Double Left Click on any point in the graph opens a floating window enabling any point to be edited, deleted, or the selected patches exported as a .csv list.
Note: As the RGB Separation graph plots calculated results, not direct patch values, the points selected are the equivalent Grey Scale patches.
The Display Selection drop-down enables the points list to show all profile points, the selected point, and points presently selected to be displayed via the Graph Options window, Filters option.
(The data within the Point Info dialogue is also constrained by the Patch Scale value setting, and Patch Scale should be set to match the values used when the profile was generated.)
The Export selection option will export a .csv list of the selected points, and can be used to export specific patches, such as for use with Extended Probe Dynamic Range.
The Save selection option will save the selected points as a new Profile, enabling alternate profiles to be saved as a sub-set of the original profile.
A Double Left Click on any point in the graph also set the patch colour, and sliders in Manual Measure, to the colour of the selected point, enabling individual points to be re-measured as required.
RGB Balance Graph
The RGB Balance icon button selects the RGB Balance graph within the main Profiling window.
Using Ctrl + RGB Balance icon button will pop-out floating RGB Balance graphs each time the combination is pressed. Each can be zoomed and pan & scanned, as well as positioned independently.
Left Click enables pan & scan, and Right Click enables zoom.
Zoom can also be controlled via a mouse scroll wheel and two finger touchpad.
Double Right Click resets the graph.


The screen position of each pop-out floating graph will be remembered when ColourSpace is closed, and re-opened in the same order/position as well as internal zoom & position.
When the mouse is hovered over the graph a Graph Options Hamburger button will appear, and provides access to graph specific options, such as for Point Adjust and Absolute plotting.
Double Left Click on any point in the graph opens a floating Point Info window enabling any point to be edited, deleted, or the selected patches exported as a .csv list.
Note: If Probe Matching is active points cannot be edited either via Point Adjust or via the Point Info window.
The Display Selection drop-down enables the points list to show all profile points, the selected point, and points presently selected to be displayed via the Graph Options window, Filters option.
(The data within the Point Info dialogue is also constrained by the Patch Scale value setting, and Patch Scale should be set to match the values used when the profile was generated.)
The Export selection option will export a .csv list of the selected points, and can be used to export specific patches, such as for use with Extended Probe Dynamic Range.
The Save selection option will save the selected points as a new Profile, enabling alternate profiles to be saved as a sub-set of the original profile.
A Double Left Click on any point in the graph also set the patch colour, and sliders in Manual Measure, to the colour of the selected point, enabling individual points to be re-measured as required.
If the Show/Enable Point move options have been enabled via additional Graph Options, a Double Left Click on any point in the graph selects the point, and opens a floating values window. After a point has been selected, hovering over it will display Point Adjust arrows, enabling the selected point to be manually adjusted, as well as allowing the values in the floating window to be directly edited.
As a point is adjusted, a yellow Tangent Line will show the deviation from the point's original location. Reset and Apply buttons also become enabled when a point has been repositioned.
If multiple points are adjusted, but not Applied, the point's dot marker will be shown larger than normal to signify an adjustment has been made. All individual adjusted points need to be Applied before the profile is Saved.
Note: When Apply is actioned is is likely other components with the graph will change, due to value interaction, as well as affecting other graphs, such as changes to RGB Balance altering EOTF.
Any changes to a point are mapped live across all associated graphs, such that changes to grey scale points made in the CIE graphs will be mirrored within the associated RGB Balance, EOTF, RGB Separation graphs, etc. Using the pop-out floating graphs capability means all associated graphs can be viewed simultaneously while making Point Adjust changes.
Repeated double right clicking of a given point will cycle through all three RGB colours, should they all have the same coordinates, and will bring to the front the selected colour channel's graph line in 1D graphs.

The floating Point Adjust values window can be repositioned using the floating window's top bar, and if placed back over its active point will re-dock back to its default location.
Delta-E Graph
The Delta-E icon button selects the Delta-E graph within the main Profiling window.
Using Ctrl + Delta-E icon button will pop-out floating Delta-E graphs each time the combination is pressed. Each can be zoomed and pan & scanned, as well as positioned independently.
Left Click enables pan & scan, and Right Click enables zoom.
Zoom can also be controlled via a mouse scroll wheel and two finger touchpad.
Double Right Click resets the graph.


The screen position of each pop-out floating graph will be remembered when ColourSpace is closed, and re-opened in the same order/position as well as internal zoom & position.
Double Left Click on any point in the graph opens a floating Point Info window enabling any point to be edited, deleted, or the selected patches exported as a .csv list.
Note: If Probe Matching is active points cannot be edited either via Point Adjust or via the Point Info window.
The Display Selection drop-down enables the points list to show all profile points, the selected point, and points presently selected to be displayed via the Graph Options window, Filters option.
(The data within the Point Info dialogue is also constrained by the Patch Scale value setting, and Patch Scale should be set to match the values used when the profile was generated.)
The Export selection option will export a .csv list of the selected points, and can be used to export specific patches, such as for use with Extended Probe Dynamic Range.
The Save selection option will save the selected points as a new Profile, enabling alternate profiles to be saved as a sub-set of the original profile.
A Double Left Click on any point in the graph also set the patch colour, and sliders in Manual Measure, to the colour of the selected point, enabling individual points to be re-measured as required.
Delta-E Distribution Graph
The Delta-E Distribution icon button selects the Delta-E Distribution graph within the main Profiling window.
Using Ctrl + Delta-E Distribution icon button will pop-out floating Delta-E Distribution graphs each time the combination is pressed. Each can be zoomed and pan & scanned, as well as positioned independently.
Left Click enables pan & scan, and Right Click enables zoom.
Zoom can also be controlled via a mouse scroll wheel and two finger touchpad.
Double Right Click resets the graph.


The further to the left, narrower, and taller, the graph plot, the better the results.
The screen position of each pop-out floating graph will be remembered when ColourSpace is closed, and re-opened in the same order/position as well as internal zoom & position.
Clip Graph
The Clip icon button selects the Clip graph within the main Profiling window.
Using Ctrl + Clip icon button will pop-out floating Delta-E Distribution graphs each time the combination is pressed. Each can be zoomed and pan & scanned, as well as positioned independently.
Left Click enables pan & scan, and Right Click enables zoom.
Zoom can also be controlled via a mouse scroll wheel and two finger touchpad.
Double Right Click resets the graph.


The screen position of each pop-out floating graph will be remembered when ColourSpace is closed, and re-opened in the same order/position as well as internal zoom & position.
Double Left Click on any point in the graph opens a floating window enabling any point to be edited, deleted, or the selected patches exported as a .csv list. Note: As the Clip graph plots calculated results, not direct patch values, the points selected are the equivalent Grey Scale patches.
The Display Selection drop-down enables the points list to show all profile points, the selected point, and points presently selected to be displayed via the Graph Options window, Filters option.
(The data within the Point Info dialogue is also constrained by the Patch Scale value setting, and Patch Scale should be set to match the values used when the profile was generated.)
The Export selection option will export a .csv list of the selected points, and can be used to export specific patches, such as for use with Extended Probe Dynamic Range.
The Save selection option will save the selected points as a new Profile, enabling alternate profiles to be saved as a sub-set of the original profile.
A Double Left Click on any point in the graph also set the patch colour, and sliders in Manual Measure, to the colour of the selected point, enabling individual points to be re-measured as required.
Drift Graph
The Drift icon button selects the Drift graph within the main Profiling window.
Using Ctrl + Drift icon button will pop-out floating Drift graphs each time the combination is pressed. Each can be zoomed and pan & scanned, as well as positioned independently.
Left Click enables pan & scan, and Right Click enables zoom.
Zoom can also be controlled via a mouse scroll wheel and two finger touchpad.
Double Right Click resets the graph.


The screen position of each pop-out floating graph will be remembered when ColourSpace is closed, and re-opened in the same order/position as well as internal zoom & position.
When the mouse is hovered over the graph a Graph Options Hamburger button will appear, and provides access to graph specific options, such as for Point Adjust.
If the Show/Enable Point move options have been enabled via additional Graph Options, a Double Left Click on any point in the graph selects the point, and opens a floating values window. After a point has been selected, hovering over it will display Point Adjust arrows, enabling the selected point to be manually adjusted, as well as allowing the values in the floating window to be directly edited.
As a point is adjusted, a yellow Tangent Line will show the deviation from the point's original location. Reset and Apply buttons also become enabled when a point has been repositioned.
If multiple points are adjusted, but not Applied, the point's dot marker will be shown larger than normal to signify an adjustment has been made. All individual adjusted points need to be Applied before the profile is Saved.
Note: When Apply is actioned is is likely other components with the graph will change, due to value interaction as the average Drift value is calculated from all drift measurements.
Repeated double clicking of a given point will cycle through all three RGB colours, should they all have the same coordinates, and will bring to the front the selected colour channel's graph line in 1D graphs.

The floating Point Adjust values window can be repositioned using the floating window's top bar, and if placed back over its active point will re-dock back to its default location.
Graphs
The Graphs display the selected profile, based on the selected Graphs Icon Button.
For 2D graphs, Left Click enables pan & scan, and Right Click enables zoom.
For 3D graphs, Left Click enables rotation, Right Click enables zoom, and Ctrl + Right Click enables position.
For all graphs, Zoom can also be controlled via a mouse scroll wheel and two finger touchpad.


Double Right Click resets the graphs.
When the mouse is hovered over the graph a Graph Options Hamburger button will appear, and provides access to graph specific options, such as for Point Adjust and Absolute plotting.
Double Left Click on any point in the graph opens a floating Point Info window enabling any point to be edited, deleted, or the selected patches exported as a .csv list.
Note: If Probe Matching is active points cannot be edited either via Point Adjust or via the Point Info window.
The Display Selection drop-down enables the points list to show all profile points, the selected point, and points presently selected to be displayed via the Graph Options window, Filters option.
(The data within the Point Info dialogue is also constrained by the Patch Scale value setting, and Patch Scale should be set to match the values used when the profile was generated.)
The Index sort option will re-order the patch list based on the patch index number. Disabling it list the patches based on the patch colour values.
The Export selection option will export a .csv list of the selected points, and can be used to export specific patches, such as for use with Extended Probe Dynamic Range.
The Save selection option will save the selected points as a new Profile, enabling alternate profiles to be saved as a sub-set of the original profile.
A Double Left Click on any point in the graph also sets the patch colour and sliders in Manual Measure to the colour of the selected point, enabling individual points to be re-measured as required.
If the Show/Enable Point move options have been enabled via additional Graph Options, a Double Left Click on any point in the graph selects the point, and opens a floating values window. After a point has been selected, hovering over it will display Point Adjust arrows, enabling the selected point to be manually adjusted, as well as allowing the values in the floating window to be directly edited.
As a point is adjusted, a yellow Tangent Line will show the deviation from the point's original location. Reset and Apply buttons also become enabled when a point has been repositioned.
If multiple points are adjusted, but not Applied, the point's dot marker will be shown larger than normal to signify an adjustment has been made. All individual adjusted points need to be Applied before the profile is Saved.
Note: When Apply is actioned is is likely other components with the graph will change, due to value interaction, as well as affecting other graphs, such as changes to RGB Balance altering EOTF.
Any changes to a point are mapped live across all associated graphs, such that changes to grey scale points made in the CIE graphs will be mirrored within the associated RGB Balance, EOTF, RGB Separation graphs, etc. Using the pop-out floating graphs capability means all associated graphs can be viewed simultaneously while making Point Adjust changes.
Repeated double clicking of a given point will cycle through all three RGB colours, should they all have the same coordinates, and will bring to the front the selected colour channel's graph line in 1D graphs.

The floating Point Adjust values window can be repositioned using the floating window's top bar, and if placed back over its active point will re-dock back to its default location.
(Click the Profiling Graphs icons ![]() for more information.)
for more information.)
Target Gamut/EOTF
The Target Gamut/EOTF drop-down allows the selection of any colour space - preset or user - to be used as the target for profile measurements. The accuracy of any measured value is compared to the selected colour space, and the set Profile Luma Min/Max values for the selected colour space.
With higher ColourSpace license levels, it is possible to Double Right Click the Target Gamut/EOTF selection to open a Modify window, as available within the main Library options. The Modify window will allow transient changes to be made to the selected colour space, with all changes live updated enabling alternate colour space comparisons to be made.
As the Modify window is non-modal, it can be kept open and different comparisons made with different colour space settings.
As soon as the Modify window is closed, the colour space will default back to its original selection/settings.

Any changes made to the selected colour space will not be saved into the Library unless the Save button is used.
Sub-Space Gamut/EOTF
The Sub-Space Gamut/EOTF option allows the selection of any colour space - preset or user - to be used as a Sub-Space target for profile measurements.
When enabled, the Sub-Space colour space is treated as the Target colour space, enabling a display calibrated for a different colour space - say DCI P3 - to be profiled as if it were actually calibrated to the Sub-Space colour space - say Rec709 - to verify if the display can accurately cover the Sub-Space colour space.
The Enable tick box enables the use of Sub-Space when profiling, with the graphs plotting based on the Sub-Space colour space.
Note: When a Sub-Space profile is Saved, it can be saved as a default Sub-Space profile, which will plot using the Sub-Space colour space, as defined above.
Alternatively, the additional Sub-Space Calibration option, within Graphs Options, can be use to set the Saved profile data as a Sub-Space Calibration. With Sub-Space Calibration selected, the profile data is mapped to the original Target colour space, not the Sub-Space colour space. This is required if the Sub-Space profile is to be used for LUT Generation, where the calibration target is the main Target colour space, and the Sub-Space is being used to profile a reduced gamut within the Target colour space.
Luma Target
The Target Luma (nits) editable value boxes set the luma Min/Max targets against which measurements are compared, in combination with the selected Target Gamut/EOTF for the active colour spaces.
The two Update buttons can be use to individually set the Min/Max values from direct probe readings, while the Auto button sets both automatically. Three readings are taken for Black and White, and averaged for a final value.
(The Patch Size/BG Colour icon can be clicked to pop-out the ColourSpace patch window.)
The CR value box displays the Contrast Ratio based on the Min/Max values.
When opening a new Profile window, the Min/Max values will be set to the last values set by the user, or for absolute (ST2084/PQ) colour spaces, will be set to the peak value defined in the selected colour space.
Note: If a PQ absolute colour space is in use, and the Target Luma Max value is changed, toggling to another Target Gamut/EOTF and back to the PQ space will reset the Max value, unless the Auto option is enabled.
When opening an existing Profile the Target Min/Max values are auto-updated depending on the status of the ^ up-arrow Auto option within Profile Luma (nits). If Auto was enabled when the Profile was saved, the Target Min/Max values will be set to the profile's measured values. If Auto was not enabled, the user set Target Min/Max values will be recalled.
Profile Luma
The Profile Luma Min/Max value boxes display the Min/Max values read from the active profile, and updates every time a new Black/White patch is measured.
(The Min/Max values are only updated when the correct Black/White patches are measured for the set Patch Scale.)
The ^ up-arrow button transfers the profile Min/Max values into the Luma Target value boxes.
The Auto tick box will continuously update the Luma Target Min/Max value boxes with the Profile Luma values every time a new Black/White patch is read.
Note: When the Auto function is active, manual editing of the Target Luma Min/Max boxes is disabled.
Workflows & Layouts
The Workflows & Layouts Save button saves all user configurable settings, as well as the arrangement of the pop-out Graphs.
Saved Workflows are recalled via the Workflow Manager option in the Main Menu.
(Pop-out Graphs are recalled via the Restore option within the Graphs Options window.)
Stabilisation
The Stabilisation tick box enables the use of Stabilisation patches, which are inserted after each real patch to help counter display heat related issues, as well as ABL and colour retention issues, during profiling.
The value box defines the patch duration in seconds, and the colour patch icon enables the patch colour to be set.

The patch colour is always selected in 8-bit, and the selected colour converted to the required bit depth depending the Resolution value set. Hovering over the small patch colour box in the main Settings window will show the actual patch triplet values in the selected Resolution value - 10, 12, 14, or 16-bit.
The FW tick box forces the Stabilisation patch to Full Screen, to help overcome image burn-in.
When using FW mode, with smaller profiling patch sizes, the alternate patches may appear to momentarily flash the alternative stabilisation/measurement colour when changing to/from the FW Stabilisation patch to the smaller profiling patch. This is due to communication speed of the TPG in use, as the patch size and colour commands are sent and rendered sequentially. The probe read operation will not start until the actual patch colour command has been sent and rendered, so any momentary colour flash cannot affect the profile measurement.
The activation of Stabilisation also changes what patch colour is displayed during ColourSpace idle periods.
When Stabilisation is activated the displayed patch will immediately change to the Stabilisation patch colour & size.
When making single Manual Measure readings, the Stabilisation patch colour & size will be shown when no measurement is being taken.
When performing a Characterisation or Auto Advance Preset Patch List profile, the Stabilisation patch colour & size will be displayed when the profiling ends.
The use of Stabilisation also means the Patch Colour will not change when the Manual Measure Sliders are adjusted until a measurement is taken.
Patch Size/BG Colour
The Patch Size/BG Colour options set the various size and colour parameters for the internal ColourSpace TPG, and any attached patch generator that can use the same values.
The Diag drop-down list enables the selection of the patch size from a number of pre-set values, as well as Custom values to be set via the Area value box.
The PosX and PosY value boxes enable the patch to be positioned anywhere on the screen.
The BG Colour icon enables the patch background colour to be set, when the patch size is smaller than 100%.
The patch colour is always set in 8-bit, and the selected colour converted to the required bit depth depending the Resolution value set. Hovering over the small patch colour box in the main Settings window will show the actual patch triplet values in the selected Resolution value - 10, 12, 14, or 16-bit.
The Patch Size/BG Colour icon can be clicked to pop-out the floating patch window
Patch Scale/Resolution
The Patch Scale/Resolution options set the various patch scale range and bit depth parameters for the internal ColourSpace TPG, and any attached patch generator that can use the same values. The Manual Measure sliders also follow the defined Resolution (bit depth).
The Patch Scale drop-down list enables the selection of default patch scale ranges from a list of standard values, including Legal, Extended, and Full.
Resolution defines the bit depth to use used within Manual Measure, for the patch sliders and user defined Preset patch lists.
Limit Range limits the patch range such that the defined code value becomes the peak of the measured range, within the selected Patch Scale range. Limit Range should only be used with absolute calibration, such as PQ based HDR, unless you really know what you are doing are are after a specific limited range result.
The > arrow automatically calculates the Limit Range code value for the Target Luma Max nits value.
The Patch Scale and Limit Range settings define the working range used throughout ColourSpace, effectively setting a Sub-Range within the full range. As such, the patch colour sliders within Manual Measure will be restricted to the defined range, maintaining a 1:1 patch value for any set range, with the patch set in use being re-scaled as required.
See the Patch Scale & Resolution page for more information.
Pre-roll .csv Sequence
The Pre-roll .csv Sequence options allow the selection of a pre-roll patch set via the Folder icon button, which opens a navigation window to allow external .csv lists to be imported. The Delete icon button will delete any selected Pre-roll .csv sequence.
Note: Pre-roll works only with Characterisations, not with the Manual Measure options.
The numerical box next to the drop-down list shows the number of patches within the imported .csv list.
The Time Per Patch value box set the duration each Pre-roll patch will be displayed for.
The FW tick box forces the Pre-roll patches to Full Screen, to help overcome image burn-in.
Active LUT
The Active LUT drop-down list enables any LUT held within the Working LUTs library to be used as an active LUT within different ColourSpace operations, such as patch generation during profiling.
Progress Bar
The Green Progress Bar shows when a measurement is being taken, as well as the number of patches that have been read out of the total in the patch sequence. If Pre-roll is used the Progress Bar will show the Pre-roll duration in Cyan.
The Abort button cancels any profile in progress, after the present patch being read finishes, and saves the partial results.
The Pause button pauses any profile or Pre-roll in progress, and re-starts when pressed for a second time, when the button shows Continue.
When a profiling is Paused, the remaining patches shown within the Progress Bar will also change to Yellow.
Probe Options
The Probe Options window provides access to all available settings associated with probe integration.
For detailed information on the available options for a given probe see the ColourSpace Guides.

Probes
The Probes drop-down list enables the selection of the probe to be used with the open Profiling window. Multiple Profiling Windows can be opened simultaneously, and connected to different Probes.
(The Virtual Probe provides a selection of option, including mimicking perfect displays for different EOTFs and Colour Spaces, using values set within the Settings menu for Patch Scale, etc.)
Connected Probe
The Connected Probe options provide the ability to connect to the desired probe, as selected via the Probes drop-down list.
The Connect button initiates the probe connection, with the probe name/serial number displayed in the above text box, with the Red Disconnected info box changing to show Connected, as well as becoming Green in colour.
The Auto tick box enables the selected probe to be automatically connected each time ColourSpace is started, and the Profiling window opened.
Serial Port
The Serial Port options are available for selected probes that use serial communication, with the drop-down list showing all active serial ports.
If necessary, the Rescan button can be used search for missing serial ports.
The Auto tick box will re-select the last used Serial Port, assuming it is still available, each time ColourSpace is started, and the Profiling window opened.
Network Address
The Network Address box enables the probe's IP address to be entered, if a network connection is used.
Probe Settings
The Probe Settings section provides different settings depending on the specific probe in use.
(For information on specific probes see the ColourSpace Guides.)
Probe Adjustments
The Configure Matching button opens a new window, with options for probe matching, using both Matrix and Profile based matching methods, with an option to force the old FCMM method. See Probe Matching for more info.
Matrix based probe matching, for both FCVM and FCMM modes, is generated and set-up from within the Probe Matching menu, while MPVM is generated from standard profiles via the Colour Space Library, using the Modify option within the Library.

The Active Probe/Display Data drop-down list allows the selection of any active probe (Tristimulus) match data, while the Reference Probe/Display Presets drop-down allows the selection of the matching reference probe (Spectro) match data.
If no probe match data has been saved, the New button (available when a probe is connected) enables a name to be defined for a new probe match, and the Measure buttons can be used to profile the presently active probe. The individual << Measure buttons can be used to update each RGBW Yxy values, or the Measure All button used to update all simultaneously.
Clicking the Patch Colour icon pops out the floating patch window.
The saved probe profile data can then be used as Active or Reference, as needed.
When Active probe data is selected in the drop-down the New button changes to Copy, enabling the present probe data to be re-named, and re-profiled as required.

The Yxy numeric value boxes can also be manually edited, enabling data from external sources to be used.
The Force simple matrix match option forces the use of FCMM rather than FCVM for a matrix based probe match, and can be toggled on/off while Probe Matching is active to directly see the difference in application within the profile graphs.
Within the main Profiling window, the Offset xy values enable simple offsets, such as Judd-Vos, to be employed.
(We do not recommend the use of such simple offsets.)

The Extra Delay (sec) option enables a fixed delay to be set from the moment a patch is displayed within ColourSpace to the point at which the probe starts the measurement, to allow for signal path delays to the display being profiled.
The Auto button can be used with some probes to set the Extra Delay automatically, by first opening a patch window on the display to be profiled, placing the probe on it, and pressing the Auto button.
Note: Some probe/setting/display combinations will not work reliably with the Auto function, due to the way some probes automatically alter their own settings, and will require manual experimentation to define the correct value.
Extra Delay sets a delay time after the patch has changed before probe measurement starts, and manages signal path delays in the image pipeline. There is a 100ms delay built into ColourSpace, so any delay 100ms or less will result in a Zero Extra Delay value.
When using the Auto option, Intelligent Integration & Average Low Light should normally not be used, but can be kept enabled if desired.
Hardware Options
The Hardware Options window provides access to all available settings associated with hardware integration, including displays, LUT boxes, and TPGs.
For detailed information on available options for specific hardware devices see the ColourSpace Guides.

Hardware
The Hardware drop-down list enables the selection of the display, LUT Box, or TPG to be used with the open Profiling window. Multiple Profiling Windows can be opened simultaneously, and connected to different Hardware.
Connected Hardware
The Hardware options provide the ability to connect to the desired hardware, as selected via the Hardware drop-down list.
The Connect button initiates the hardware connection, with the hardware name/serial number displayed in the above text box, with the Red Disconnected info box changing to show Connected, as well as becoming Green in colour.
The Auto tick box enables the selected hardware to be automatically connected each time ColourSpace is started, and the Profiling window opened.
Serial Port
The Serial Port options are available for selected hardware that use serial communication, with the drop-down list showing all active serial ports.
If necessary, the Rescan button can be used search for missing serial ports.
The Auto tick box will re-select the last used Serial Port, assuming it is still available, each time ColourSpace is started, and the Profiling window opened.
Network Address
The Network Address box enables the hardware's IP address to be entered, if a network connection is used.
Calibration Patches
The Calibration Patches options provide access to the specific patch size options for the connected hardware.
Automatic uses the patch settings within the ColourSpace Settings window, if applicable, and Custom patch settings are defined via the connected hardware Options window.
Select LUT
The Select LUT drop-down list enables any LUT held within the Working LUTs library, or LUT Bypass information, to be uploaded into the connected hardware via the Upload button, if applicable for the connected hardware.
When Unity Bypass data is uploaded all settings will be nullified, not just the relevant LUTs, although actual LUT data may not be uploaded, depending on the hardware connected.
Hardware Settings
The Hardware Settings section provide different settings depending on the specific hardware in use.
(For information on specific hardware settings see the ColourSpace Guides.)
Graph Options
The Graph Options window provides access to all features and options for the various graphs, defining the data to be displayed, and how it will be displayed.

delta-E
The delta-E drop-down enables different delta-E standard to be used within the graphs, for the point colours, and associated measurement values shown in the Manual Measure window.
Gamut Triangle Level
The Gamut Triangle Level drop-down enables different matched RGB primary luma levels within a profile to be plotted, displaying gamut changes associated with luma level changes.
Filters
The Filters tick boxes enable the selection of profile points to be displayed on the various graphs, in combination with the delta-E Filter drop-down list options.
Custom Filters
Custom Filters are a very powerful tool to help define the exact points that are to be displayed within the various graphs.
The text area is where the filter algorithms are entered.
The Enable tick box will enable/disable any algorithm held within the test area.
Reset will remove any filter algorithm entered within the text area.
Apply applies any changes made to the filter algorithm.
The Close button closes the Custom Filter window, with the filter algorithm still active in the Enable tick box is ticked.

The Export and Import icons enable any user defined Custom Filters to be saved externally, and re-imported as needed.
For more information see Custom Filters.
delta-E Filters
The delta-E Filter Range Min/Max values enable the selection of the range for profile points to be displayed on the various graphs, in combination with the Filters options, and the selected delta-E standard.
The Green, Orange, and Red tick boxes display the selected colour points, based on the defined dE range for each profile point, for the selected dE standard.
The Threshold Min/Max values define custom values for the R, G, B colour coding of measured points. When not enabled the system defaults are used.
- Green ≤ 1dE
- Orange > 1dE ≤ 2.3dE
- Red > 2.3dE
Graphs
The 3D Selection drop-down list defines the 3D Graphs being displayed when the 3D Graph icon is selected as the active graph.
The Restore button will open the pop-out graphs associated with the loaded Workflow.
Overlay
The Tangent tick box enable Tangent lines to be displayed on the CIE graphs, which show the errors associated with any given point (where the point measurement should have been, compared to where it actually is).
When a single point is selected, all other Tangent lines will be dimmed. Setting a colour value that has not been measured will make all Tangent lines bright.
The Targets tick box swaps the points to display where the measurements should, and colour-codes them to their actual colour. The Tangent lines will also work in reverse.
Processing
The Processing options define how profile data is plotted, and more importantly how it is Saved.
The Drift tick box enables the impact of applying ColourSpace's unique Drift Processing to be seem directly on the profile measurements, with the difference between Drift Processing on/off displayed on the selected graphs.
When Drift Processing is applied, the graphs show the correction to be used for LUT Generation, not a visual correction for the measured profile data.
The Probe Matching Active tick box enables ColourSpace's unique post-profiling Probe Matching, if set within the Probe Options Probe Matching option, with the difference between probe matching on/off displayed on the selected graphs.
When a profile is saved into the Library, the state of the Drift and Probe Matching Active tick boxes define the state of the data saved in the new profile.
The Sub-Space Calibration option sets the Save mode for a profile generated with Sub-Space active within the Settings menu.
With Sub-Space Calibration enabled, the profile is saved with the profile data mapping to the original Target colour space, not the Sub-Space colour space, enabling the profile to be used for LUT Generation.
(For flexibility, it may be preferable to save any given profile more than once - with/without Drift and/or Probe Matching active, and potentially with/without Sub-Space Calibration.)
Profile
The Delete Points button deletes all profile points, and starts a new profile.
The Save button saves the present profiling into the Library, allowing for a new name to be entered if required
The Add Notes button enables user text notes to be added to the present profile.

Within the Notes contents, Report Tokens are treated as plain text, so will 'print' as raw text.
HTML Markup will be parsed as HTML, so <b>text</b> will print as text.
Rename enables an existing profile to be saved with a new name, as well as pre-defining a name before profiling starts.
Measurement Log
The Measurement Log tick box enables measurements made via the Manual Measure window, including Preset .csv lists, to be logged in a pre-determined .csv file, including patch colour, measured values, and total time taken for each measurement, including associated overheads.
(Characterisations cannot be saved via Measurement Log.)
The ... button enables the .csv file location and name to be pre-defined, and displayed in the associated text box.
Secondary Execution
The Secondary Execution tick box enables any measurements made via ColourSpace, including Manual Measurement, Presets, and Characterisations, including any active Probe Matching, to be simultaneously sent to a 3rd party program for external processing, such as alternative plotting, etc.
The Customer Downloads, Integration Protocols, includes an example batch file that writes all measured data into a .txt file.
The ... button enables the 3rd party program location to be navigated to, with the location displayed in the associated text box.
See the Remote control & Secondary Execution Video Guide for further information.
Remote Control
The Remote Control tick box enables multiple Servant instances of ColourSpace Profiling windows to be controlled via a Master Profiling window, or via a 3rd party program.
The Customer Downloads, Integration Protocols, include example source code that can be compiled into a demo executable program for 3rd party Remote Control.
The main Remote Control drop-down enables the selection of the Remote Control operation for the selected Profiling window - Servant or Master.
For the Remote Control option to be active a probe must be connected.
The Measurement drop-down defines what measurement data will be recorded within the Master Profiling window - Local, Remote, or Averaged.
The ID box is used to enter the Port number for the Servant instance of the ColourSpace Profiling window, and is 20102.
For connections over the internet, the IP address of the remote PC will need to use used, in addition to the Port number, and may need Port Forwarding to be set on any routers.
See the Remote control & Secondary Execution Video Guide for further information.
EDID Viewer
The EDID Viewer button opens a new floating window, which displays the EDID info for any displays connected to the ColourSpace PC using the Windows API, defined by (Win) at the end of the name of the connected display in the drop-down list.
If EDID capable hardware is connected to the ColourSpace PC, such as a Murideo SIX-G, SEVEN-G, or PGen, the EDID info held within the connected hardware will also be available via an additional entry within the drop-down list, as well as a dedicated EDID option with the Hardware Options menu.

The Save and Load buttons enable EDID binary files to be saved external to ColourSpace, as needed.
EDID info can be very useful when diagnosing signal path issues, especially incorrect range configurations.
Manual Measure
The Manual Measure window provides access to all features and options used for manual display measurement and calibration.

Zoom Widget
The Zoom Widget shows a selected, zoomed, area of the active 2D CIE xy or CIE uv charts, centralised on the present colour being measured.
The offset from the centre of the zoom widget shows the colour error, relative to the target colour space.
Bars Widget
The Bars Widget provides another indication of the measured colour error, relative to the target colour space.
In its default mode, the bars show any colour error based on R, G, and B values, with the displayed error a combination of gamut and luminance, with the 4th bar showing luminance independently, and the 5th, chequered, bar showing the dE error.
In addition to the height of the bars defining the colour error, the intensity of the bar's colour increases with a greater error value. The Bars Widget auto zooms resolution, depending on the measured error value.
Hovering over the Bars Widget displays two additional options that change the operation of the widget.

Chroma Only removes the effect of luminance from the R, G and B bars, displaying just the gamut error, with the luminance error still being displayed via the luma bar, plus the dE bar.
Note: The removal of the effect of luminance means the bars will show a great visual error with Chroma Only enabled for a given measurement with a high luminance value, much like dE values.
HSL changes the widget to display Hue, Saturation, and Luminance, along with the dE bar.

With HSL mode, the first bar shows the Hue error, with a negative bar representing a counter clockwise error, and a positive bar a clockwise error. The second bar shows a saturation error, with the luma and dE bars operating as normal.
In addition to the height of the bars defining the colour error, the intensity of the bar's colour increases with a greater error value, as well as showing the colour being adjusted.
Colour Space
The Colour Space information box displays the target Colour Space, as selected within the Settings window.
Target & Actual Y Min/Max
The Target & Actual Y Min/Max values displays the Luminance Target Min/Max, as set in the Settings window, as well as the Actual measured Min/Max values.
The associated CR values show the Target and Actual Contrast Ratios, based on the Min/Max values.
Target & Actual Values
The Target & Actual Values display the target and actual Yxy, or Yuv values for each point being measured, or for a point selected within a profile post-measurement. The display of the value being Yxy, or Yuv, is defined by the last 2D CIE graph selected.
The Deviation value shows the error between the measured and target value, either as a numerical difference, or as a % variation, if the Deviation % box is ticked.
The dE values show the selected point and profile average dE values using the dE standard set in the Graph Options page.
The EOTF values show the selected grey scale point EOTF value, as well as the overall average EOTF.
Point information is only displayed when a measured point is selected, which means EOTF values are only displayed when a grey scale point is selected.
Deviation %
The Deviation % tick box changes the numerical Deviation value within the Target & Actual Values to be displayed as a percentage error value, rather than a difference error value.
Gamut Coverage
The Gamut Coverage button opens a floating window that first calculates, and then displays, a volumetric Gamut Coverage percentage value, based on the available profile points, the target colour space, and the code range (definable via Limit Range in Settings).

After processing completes, the pop-up window is replaced with the calculated Gamut Coverage.
The Cancel button can be used to cancel the gamut coverage calculation, if the profile has issues causing extended processing. Cancelling can take up to 30 seconds or so to complete.

The more points in the actual profile, the more accurate the volumetric Gamut Coverage value will be. Invalid profiles, for example lacking 100% RGB values, will generate invalid Gamut Coverage values.
For a volumetric profile, rather than a Quick Profile, a minimum 33 profile is required to generate a Gamut Coverage value.
With Quick Profiles, the limited measurements are permuted into a full volumetric data set, meaning the calculated gamut coverage value will be less accurate - in line with systems that generate such values from basic 2D CIE graph plots.
The Gamut Coverage window will also not lock access to the main Profiling window, which means different profiling results can be compared for gamut coverage.

The above shows a small volumetric cube profile vs a larger volumetric profile on the same display.
Test Patterns
The Test Patterns button opens a floating window that enables different test patterns to be selected and displayed via the Patch Window.

- Probe Alignment
- Granger
- Contrast
- Brightness
- ANSI 1
- ANSI 2
- Corner-Box 1
- Corner-Box 2
- Ramp BW Horiz
- Ramp BW Vert
The Contrast and Brightness patterns flash, to aid visualisation of clipping points.
(The in-built Test Patterns follow the Patch Scale values set within Settings. See the Patch Scale page.)
Measurement
The Measurement buttons provide for single manual measurements, via the Measure button, or for continuous repeated measurements when the Repeat button is active.
Patch Colour
The Patch Colour options enable the desired target patch colour to be set for manual measurements.
The Patch Colour icon shows the colour set, and when clicked will open the floating patch window. Hovering over the patch window will show position, colour, and probe information, as well as a resize corner icon, and close X.


A double click on the patch window will enable full-screen mode, and show any patch size/position, and BG colour, set within the Settings window. A second double click will reduce the patch window back to its small size.


The R G B slider header button can be toggled to change the sliders into HSL mode, enabling the patch colour to be set using Hue, Saturation, and Luminance, as degree & percentage values, matching some TV's own CMS controls.
The three Value boxes show the slider settings, and can have values manually entered.
The Sliders can be position manually, either via the slider control, or clicking above/below the slider control, which will move the slider by the value entered in the Step box, or moved one LSB via the up/down Arrow boxes.
If one of the Sliders is selected/highlighted, either by using the Tab key, or by clicking on the slider, the keyboard Page-Up/Page-Down keys, or the Fn+Arrow keys, can be used to move the Sliders by the Step value.
When using the Step function the sliders will remain locked to their position relative to their starting values, so maintaining their absolute step values when moving up/down the slider range, and will not clip at the slider extremes.
The Tick Boxes can be used to lock sliders together, and when in RGB mode the % tick box changes the sliders from bit values to % values.
Note: When using the % option, the Step function will vary slightly, as each % step can define more than one LSB value./p>

The Presets button swaps the Sliders into a user definable preset patch list window, with the Folder icon button opening a navigation window to allow external .csv lists to be imported.
The text area below the Patch Colour displays the select patch values, as well as a user definable name, if included in the .csv list. The first numerical column defines a patch number, and can be in any order.
For optimal accuracy the Patch List values should match the Patch Scale set within the Settings menu - Full, Legal, or Extended, as well as matching the defined Resolution (bit depth). See Patch Scale & Resolution for further information.

Clicking directly on any colour patch in the Preset List will display the selected colour. A double click will initiate a probe reading as well as displaying the patch colour.
The Auto Advance tick box will automate stepping through the Preset patches, moving on to the next patch when a measurement has finished.
The Manual button returns to manual sliders operation.
Characterisation
The Characterisation window provides access to all features and options for automated display profiling, generating characterisation profiles that define the display characteristics.

Mode
The Mode options define the characterisation to be used, either from the preset drop-down list, from the selected Custom option, defined via the Custom Sequences Manage button, or via the Current Point Info Selection option, which uses the Point Info window to define the points to be remeasured, enabled via the relevant Tick Box.
The different pre-sets provide standard profiling options, with Cube, Body Centre Cube, and Grey Ramp options being the normal choices for LUT Generation, and Memory Colours, Gamut Sweep, and Edge Sweep being more focused on verification, although any profiles can be used for LUT Generation.
- Cube Based
- Body Centre Cube Based
- Grey Ramp RGB
- Grey Ramp RGBCMY +
- Grey & Primary Ramp
- Grey Primary & Secondary Ramp +
- Memory Colours RGB
- Memory Colours RGBCMY
- Gamut Sweep 75% Primary
- Gamut Sweep 75% Primary & Secondary
- Gamut Sweep 100% Primary
- Gamut Sweep 100% Primary & Secondary
- Edge Sweep
With higher ColourSpace license levels, depending on the pre-set selection there will be three different tabs selectable to alter the available profiling mode parameters. For Cube based modes the two options are Cube Size and Grey Axis Size. For Quick Profiles, Ramp Size will be available for those Quick Profiles with definable ramps, and Colour Size for Gamut Sweeps.
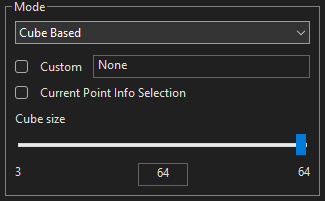
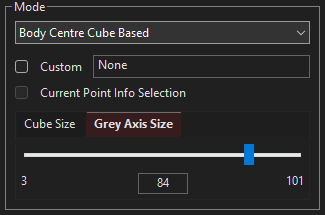
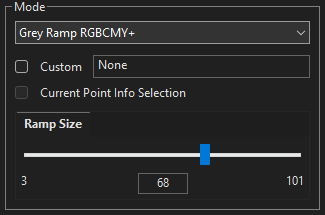

The Cube Size slider defines the patch sequence to be used when either of Cube options are selected from the drop-down list. The value used defines the cube side, so 33 defines 35,937 patches (333) for a standard Cube Based selection, and 68,705 patches for a Body Centre Cube Based selection (a 333 cube containing a 323 cube within it, with 2x-1 - 65 - grey axis patches). Values can be entered via the slider, or via the numeric value box.
The Grey Axis Size, when available, defines an independent number of patches to be used for the grey scale, up to a maximum of 101.
With higher license levels a Red tint to the Grey Axis Size tab defines the Grey Axis Size as being greater than the default Grey Axis Size value based on the defined Cube Size value. If the Cube Size is re-altered, the Grey Axis Size will default back to the default Grey Axis Size for the defined Cube Size.
The BCC (Body Centred Cube) option sets the Grey Axis Size to 2x-1 of the Cube size by default, up to a maximum grey scale size of 33 for lower ColourSpace license levels.
With higher ColourSpace licenses the Grey Axis Size can be set independently, with a Red Tint to the Grey Axis Size tab defining the value as being larger than the default for the defined Cube Size.
The Ramp Size tab enables setting of the ramp size for those Quick Profiles with variable ramp size capabilities.
The Colour Size tab enables setting of the Gamut Sweep size for Gamut Sweep Quick Profiles.
Note: As with all ColourSpace Sliders, clicking to either side of the slider controls will move the slider by a pre-set value, nominally a step of one depending on the granularity of the slider, acting the same as Up/Down/Left/Right buttons.
The default Cube profiling size for ColourSpace is initially 213, but can be set up to 333 matching the native LUT Processing size. With higher license levels it is possible to use the LUT Generation Size option from the Main Menu Preferences drop-down to define internal LUT sizes up to 10243 and beyond, and the Cube Size slider can then have its maximum size value set via the numeric box to any value up to the defined LUT Generation Size, or 101, whichever is the maximum. The slider will then adopt this value as the new maximum value.
The Current Point Info Selection enables the Point Info window to be used to define the points to be remeasured via Add/Modify Points, for example in conjunction with the Custom Filter option within Graph Options.
The Custom option enables user defined .csv files to be used as patch sequences for Characterisation, which can be based on exported Characterisation Presets, including Quick Profiles, exported from ColourSpace.
(For example, change the value of the RGB/CMY patches in Grey Ramp sequences, for use with HDR profiling.)
Patch Sequence
The Patch Sequence Sorting options define the order the patches are displayed in.
Anisometric averages the power of the patch sequences, swapping between bright/dark patches, so minimising heat related issues, and can be used with both internally generated ColourSpace patch sets, as well as with User Patch Sets.
Sequential can be useful for diagnostic applications (isolating signal path issues for example), or for use with DIP Mode and Ted's LightSpace Calibration Disc.
UnSorted is predominantly used with User Generated .csv Patch Sets, to maintain the order as per the .csv file list.
Drift Compensation
The Drift Compensation options define a fixed patch colour to be inserted every nn frames, enabling the measured values for each drift patch to be used to compensate for display/probe drift during profiling. As much as possible, Drift data should be used to help define the best Patch Set, Stabilisation, Pre-roll, and Drift patches themselves to be used to minimise actual drift during profiling.
(Drift Patch data can also used during LUT Generation, but ideally should be a last resort.)
Drift is only available with Cube profiles and user generated patch sets, not in-built Quick Profiles.
The Drift Tick Box enables Drift Compensation measurements, with the Drift patch being added after every nn frames, as defined via the Frames value box.
The Colour icon enables the Drift patch colour to be set. The Drift patch value required will vary with monitor/probe combinations, but is usually around 90% of nominal 100% white.
The patch colour is always set in 8-bit, and the selected colour converted to the required bit depth depending the Resolution value set. Hovering over the small patch colour box in the main Characterisation window will show the actual patch triplet values in the selected Resolution value - 10, 12, 14, or 16-bit.
DIP Mode
DIP Mode enables the use of Display Independent Profiling, based on the Time per Patch value, which is in seconds.
DIP Mode uses a set time per patch to sync the probe measurement with any external patch sequence, not directly linked to ColourSpace, as can be generated for an edit system via the DIP mode calibration EDLs from Customer Downloads.
Duration
The Duration section displays total patch count, including Drift frames, as well as the duration for DIP mode (Closed Loop mode is always a variable duration).
Patch Colour
The Patch Colour icon shows the colour set, and when clicked will open the floating patch window. Hovering over the patch window will show position, colour, and probe information, as well as a resize corner icon, and close X.
A double click on the patch window will enable full-screen mode, and show any patch size/position, and BG colour, set within the Settings window.
A second double click on the full screen patch window will reduce it back to its small size.
Custom Sequences
The Custom Sequences option enables the import and export of patch sequences, with the Manage button opening a new Sequence window.

The folder icon button, within the Sequence section, opens a navigation window to allow external .csv patch lists to be imported. The Delete icon button will delete any selected .csv sequence.
The Export section enables any in-built profile sequence to be exported as a .csv via the Export Sequence button, or as a set of images via the Export Patches button, using the Patch Scale and Resolution parameters defined within the Settings menu.
(Export Patches enables a DIP sequence to be generated for use in an external editing system, or similar.)
The associated LUT tick box enables an Active LUT, as set via the Settings window, to be applied to the selected profile sequence during export.
When using Export Patches the associated drop-down list can be used to set the image size, including Custom settings.
Auto Save
The Auto Save tick box enables the profile to be automatically saved when characterisation completes.
The profile name can be pre-set within the Graph Options window.
Add/Modify Points
The Add/Modify Points tick box enables new measured points to be merged with with any existing profile measurements.
If the options is not enabled, a warning will be displayed if the existing profile has not been saved when Start is clicked.
Start
The Start button initiates profiling immediately.
If a delay to profiling is required, use a Pre-Roll sequence from within the Settings window.
Workflow Manager
The Workflow Manager option provides access to tools associated with Workflow generation, management, and modification, enabling different ColourSpace configurations to be quickly applied.

Workflows are ColourSpace configuration presets, that save and recall all user definable settings, as well as the arrangement of the pop-out Graphs, enabling different ColourSpace configurations and pop-out graph Layouts to be instantaneously applied.

Select Workflow Configuration
The Configuration drop-down enables selection of the desired Workflow & Layout to be recalled when the Profiling button is pressed.
Workflows save all user configurable settings, as well as the arrangement of the pop-out Graphs. To save a new Workflow, the Save Workflows option is used within the Settings window.
(Pop-out Graphs are recalled via the Restore option within the Graphs Options window.)
For safety, existing Workflows cannot be edited once saved, and if changes are required a new Workflow should be saved, and the old deleted.
The Default Workflow is always the last set of parameters defined within ColourSpace when last closed, and is updated continuously with any settings or configuration changes made.
The top bar in the Profiling Window shows the Profile Name, followed by the active Workflow, unless Default is selected and active when no Workflow name is displayed.
[D] and [M] shown before the profile name indicates the graphs are being plotted with Drift and/or Probe Matching active. A star (*) denoted the profile has not been saved.
Summary
The Summary area of the window provides information on the saved Configuration Settings of the selected Workflow.
Delete Workflow
The Delete Workflow button deletes the workflow selected in the Workflow Configuration drop-down list.
Import Workflow
The Import Workflow button enables navigation to Workflows previously exported to external storage.
Import Workflow
The Export Workflow button enables Workflows to be exported and saved to external storage.
LUT Tools
The LUT Tools window provides access to all tools associated with LUT generation, management, and modification.
(Back to Main Menu)
LUT Generation
The LUT Tools window initially opens on LUT Generation, where LUTs can be generated from colour spaces, display profiles, and camera data.

ST2084 HDR
The ST2084 PQ based HDR standard is an Absolute standard, as it maps input bits levels to absolute nits values on the display.
This means the EOTF of the standard is fixed, and never changes with display peak luminance.
When generating a LUT, the Limit Max Luminance options should be set to the same peak value as defined within target ST2084 colour space, if an accurate ST2084 LUT is desired.
The Limit Max Luminance is not forced to the peak luma value of the target colour space as it can be used to alter the EOTF of the LUT, to compensate for viewing conditions. For example, a 1000 nit peak luma display, targeting a ST2084 colour space with a 500 nit max luma, but setting the Limit Max Luminance value back to 1000 nits will lift the EOTF, making the display brighter for use in non-ideal viewing conditions.
Cube Graph
The Cube Graph icon button selects the Cube graph within the main LUT Tools window.
The graph shows how the LUT will convert input images into the output colour space, with the cube outline showing the input colour space, and the plotted points the output colour space.
Left Click enables rotation, Right Click enables zoom, and Ctrl + Right Click enables position.
Double Right Click resets the graph.

The reduced size points plot, vs the cube exterior, shows the LUT is reducing gamut, while the saturated blue points compressed against the cube side show the display is low in blue gamut, which cannot be compensated for.
1D Graph
The 1D Graph icon button selects the 1D graph within the main LUT Tools window.
The graph shows how the LUT will convert the grey scale of input images into the output colour space, with the graph diagonal defining the input colour space, and the plotted RGB lines the output colour space. The dark grey line shows the average luminance change the LUT will cause.
Left Click enables pan & scan, and Right Click enables zoom.
Zoom can also be controlled via a mouse scroll wheel and two finger touchpad.
Double Right Click resets the graph.

The separation of the RGB plots shows the LUT is changing the colour temperature, reducing blue, and to a lesser extent, green.
When the mouse is hovered over the graph a Graph Options Hamburger button will appear, and provides access to graph specific options, such as for Point Adjust.

If the Show/Enable Point move options have been enabled in the additional Graph Options as above, a Double Left Click on any point in the 1D graph selects the point, and opens a floating values window. After a point has been selected, hovering over it will display Point Adjust arrows, enabling the selected point to be manually adjusted, as well as allowing the values in the floating window to be directly edited.
As a point is adjusted, a yellow Tangent Line will show the deviation from the point's original location. Reset and Apply buttons also become enabled when a point has been repositioned.
If multiple points are adjusted, but not Applied, the point's dot marker will be shown larger than normal to signify an adjustment has been made. All individual adjusted points need to be Applied before a LUT is Saved.
Repeated double clicking of a given point will cycle through all three RGB colours, should they all have the same coordinates, and will bring to the front the selected colour channel's graph line.

The floating Point Adjust values window can be repositioned using the floating window's top bar, and if placed back over its active point will re-dock back to its default location.
LUT Preview
The LUT Preview icon button selects the LUT preview viewer within the main LUT Tools window.
The LUT preview viewer applies the LUT to a Granger image by default, allowing potential LUT artefacts to be spotted.
Left Click enables pan & scan, and Right Click enables zoom.
Zoom can also be controlled via a mouse scroll wheel and two finger touchpad.
Double Right Click resets the image.
The Apply LUT tick box appears on mouse hover, and enables/disables the LUT being applied to the image.

The image used to test the LUT can be changed via the LUT Management window, Add Picture button.
LUT Graphs
The Graphs display the selected LUT, based on the selected Graphs Icon Button, with the graph plotting the LUT points based on the native LUT Generation Size set within ColourSpace. The greater the LUT Size set, the denser the graph plots.
For the 3D graph, Left Click enables rotation, Right Click enables zoom, and Ctrl + Right Click enables position.
For the 1D graph & LUT Preview, Left Click enables pan & scan, and Right Click enables zoom.
For all graphs, Zoom can also be controlled via a mouse scroll wheel and two finger touchpad.


Double Right Click resets the graphs.
When the mouse is hovered over the 1D graph a Graph Options Hamburger button will appear, and provides access to graph specific options, such as for Point Adjust.
When the mouse is hovered over the LUT Preview image an  Apply LUT button will appear, and enable the LUT to be enabled/disabled on the selected image.
(Click the Cube Graph, 1D Graph, and LUT Preview icons ![]() for more information.)
for more information.)
Tabs
Tabs below the graphs enable the selection of any individual LUT when there are multiple LUTs open, as well as showing the LUT Name and % of gamut coverage.
A * at the end of any given LUT name denotes changes have not yet been saved into the Working LUTs Library.
Source
The Source options defines the colour space/profile/camera space of the source material to be displayed, and is therefore the target colour space being matched to when generating a LUT.
(If matching two profiles, the Source profile is therefore the master profile.)
The Drift Compensation tick box becomes available only when a profile has been selected with Drift patches included. When active, LUT Generation uses the Drift data to compensated for drift during the display profiling.
The information displayed within Source options area will vary, depending on the colour space/profile/camera space selected via the drop-down list.
With higher ColourSpace license levels, it is possible to Double Right Click the Source and/or Destination selection drop-downs when displaying Colour Space or Camera data, to open a Modify window, as available within the main Library options. The Modify window will allow transient changes to be made to the selected colour or camera space, with all changes live updated to the selected colour or camera space, enabling alternate LUTs to be quickly generated.
As the Modify window is non-modal, it can be kept open and different LUTs generated with different Colour/Camera settings.
As soon as the Modify window is closed, the colour/camera space will default back to its original selection/settings.
Any changes made to the selected colour or camera space will not be saved into the Library unless the Save button is used.
Destination
The Destination options defines the colour space/profile/camera space the source material will be displayed within, and is therefore the colour space effectively being modified when generating a LUT.
The Drift Compensation tick box become available only when the selected profile has been generated with Drift patches. When active, LUT Generation uses the Drift data to compensated for drift during the display profiling.
The Normalise Code Range tick box becomes available when the selected profile has been generated using Extended Range patch sets (16-255). When active, the profile patch data is normalised, meaning Extended range profiles are processed as not having over-range data.
(When used with Extended patch sets, and Normal selected within the Normal/Extended drop-down, the LUT Generation is processed as for previous ColourSpace versions.)
The Augmented Data tick box become available when the selected profile has been augmented with additional Grey Scale profile data. When active, the LUT Generation uses the Augmented data to increase grey scale accuracy.
The Hint tick box enables a second profile to be selected from the associated drop-down list, and used as a guide for LUT Generation.
For an end user, a large Hint profile, previously generated from the same display, can be used to supplement a smaller new profile when compensating for display drift/ageing.
For manufacturers, a large Hint profile can be generated from a single display within a given batch, or model range, and used to enhance calibration of each additional display in the batch/model range, individually profiled with a smaller patch set.
The information displayed within Destination options area will vary, depending on the colour space/profile/camera space selected via the drop-down list.
With higher ColourSpace license levels, it is possible to Double Right Click the Source and/or Destination selection drop-downs when displaying Colour Space or Camera data, to open a Modify window, as available within the main Library options. The Modify window will allow transient changes to be made to the selected colour or camera space, with all changes live updated to the selected colour or camera space, enabling alternate LUTs to be quickly generated.
As the Modify window is non-modal, it can be kept open and different LUTs generated with different Colour/Camera settings.
As the Modify window is non-modal, it can be kept open and different LUTs generated with different Colour/Camera settings.
As soon as the Modify window is closed, the colour/camera space will default back to its original selection/settings.
Any changes made to the selected colour or camera space will not be saved into the Library unless the Save button is used.
Limit Luminance
The Limit Luminance options enable the Min/Max luma for the LUT to be defined, either in nits or as a value in the range 0-1, depending on the LUT Generation settings. It also uses Peak Luma for LUT Generation, regardless of the option selected.
(If used with display calibration, the Min value should not be smaller than the Min in the profile, and the Max not set higher, and if the peak white of the display has an incorrect colour temperature will introduce channel clipping if the Limit Luminance Max value is not set low enough.)
Limit Luminance should only be used on non-PQ HDR displays when there is no way to set the desired target peak luma via Brightness/Contrast display controls.
On PQ based HDR displays Limit Luminance Max should be used to set the clip point to a specific nits value, that matches the selected target ST2084 colour space, and that is below the actual measured peak value to prevent channel clipping.
For technical conversion LUTs, the use of Limit Luminance may be required, for example when converting from HDR to SDR.
If a standard power law, BT1886, or HLG pre-set Colour Space matrix is used as the Destination, the Limit Luminance values will show as a normalised percentage value, with values from 0 to 1.0, although values over 1.0 can be entered.
Output
The Output options enable multiple parameters to be defined for LUT generation.
The Name text box enables a new LUT name to be set, before the LUT is generated.
Out of Gamut Warning configures the generated LUT to highlight colours that are outside of the display's available gamut.
(In-gamut colours are shown black & white, with out-of-gamut colours shown inverted, and fully saturated.)

Disable Gamut Mapping disables gamut edge processing when generating a LUT for displays with a native gamut smaller than the target colour space.
When a display has a native gamut smaller than the target colour space, multiple input colours at the gamut boundary will be mapped to the remaining non-clipped colour(s) on output, minus the clipped colour. Gamut Mapping applies a change to each colour value that would otherwise be clipped on output, via changes in hue, saturation or luminance, in an attempt to maintain the correct relative colour.
The XXX Range drop-down offers the selection of Normal Range or Extended Range when generating a LUT.
(When an Extended patch scale profile is being used, Normal Range will generate a LUT that uses just the 16-235 profile data range. Extended Range will use the 16-255 range. Both LUT Generation process correctly use 235 as the target peak white point.)
The optional Custom Ranges capability uses a colourSpaceCustomRanges.csv file located within the same directory as the ColourSpace .ini files - nominally C:\Users\xxxx\AppData\Roaming\ColourSpace - and if present, the XXX Range drop-down will also show the Custom Ranges options defined within that file.
The Peak Chroma drop-down list enables selection of the LUT processing algorithm to employ for LUT generation.
- Hybrid
- Map Space
- Fit Space
- Peak Chroma
- Peak Luma
Peak Chroma is the default for most LUT generation operations, while Fit Space and Map Space will not work with small profiles, and Fit Space cannot use Hint, Augment, or Drift data.
For more information on the various LUT Generation options see the LUT Generation page.
The New LUT drop-down list defines if the LUT being generated is a new LUT, or if it is to be concatenated with an existing LUT already selected within the LUT Generation window.
The Create button initiates the LUT generation process, and will pop-up a Calculating Conversion window. LUT Generation for higher-level licenses will use multi-threading, while lower-license levels will use a single thread, making multi-core PCs process much faster with higher-level licenses.
Note: When working just with colour/camera spaces, not Profiles, changing the selection of Peak Chroma, Fit Space, etc., will have no effect.
As higher ColourSpace license levels have multi-threading capability the Create button can be used multiple times with different Source/Destination configurations, or multiple LUT Generation windows can be active, as well as enabling other ColourSpace functions to be accessed while LUTs are being generated.

The Cancel button can be used to cancel the LUT generation, if the profile has issues causing extended processing. Cancelling can take up to 30 seconds or so to complete.
After LUT Generation completes a Gamut Coverage pop-up window will provided a volumetric percentage for the display gamut coverage compared to the target colour space, and the defined code value range.
The more volumetric points in the original profile, the more accurate the volumetric Gamut Coverage value will be.
Note: Peak Chroma will generate the most accurate Gamut Coverage value. Due to the way Map Space and Fit Space work, they will generate overly optimistic Gamut Coverage values.
LUT Management
The LUT Management window initially opens on LUT Generation, where LUTs can be generated from colour spaces, display profiles, and camera data.

Add LUT
The Add LUT options enable direct loading of external LUT Images, new default LUT to be generated, and existing LUTs to be copied, changes saved, and LUTs to be renamed.
The LUT Image button opens a navigation window to allow external LUT Images to be loaded directly into the LUT Tools window.
(A LUT Image is a 333 size LUT regardless of the native LUT Size set within ColourSpace, and is defined by two columns of colour patches, either side of an optional reference picture with the same LUT applied. A LUT Image can be used to share LUTs, or to be manipulated via any third-party graphics program.)

The New button generates a new LUT, with default/bypass values.
Copy copies the selected LUT, enabling changes to be made and compared to the original LUT.
The Save button will save the selected LUT into the Working LUTs library, if the LUT name is unique. If the LUT name already exists in the library a pop-up window will enable a new name to be entered before saving.
Rename opens a new window enabling the LUT name to be changed.
(A* after the LUT name denotes changes have not been saved.)
LUT Preview
The LUT Preview options enable the default Granger image to be replaced with any user image, to allow for LUT assessment on different images.
Add Picture opens a navigation window to allow any external picture to be used to assess the selected LUT, replacing the default Granger image.
Save Picture will save the present LUT Preview picture with the LUT applied, if the hover Apply LUT tick box is ticked.
Delete Picture will remove any user selected LUT Preview picture, returning to the default Granger image.
Export
The Export button saves the LUT Image as a .tif file, at a 333 size.
A LUT Image is a 333 size LUT regardless of the native LUT Size set within ColourSpace, and is defined by two columns of colour patches, either side of an optional reference picture to which the LUT can be applied. A LUT Image can be used to share LUTs, or to be manipulated via any third-party graphics program.
Vertex Data
The Vertex Data option lists all the points in the selected LUT, and enables the point data to be manually edited.
LUT Adjustment
The LUT Adjustment window enables the application of different adjustment processes to manipulate the selected LUT via a range of LUT manipulation options.

Adjustment Options
The Adjustment Options section below the LUT Adjustment tabs provides access to all the tools and capabilities associated with the selected LUT Adjustment tabs.
(Click the LUT adjustment Tabs for specific information on each tab options.)
Undo
Undo can be used to undo any/all LUT manipulations made within LUT Tools, back to the starting position.
Redo
Redo can be used to redo any/all undo's, back to the original end point.
Scaling
The Scaling tab provides options for LUT Scale adjustments, enabling the signal scale/range a LUT expects to be used with to be modified.

Video Scale
The Video Scale drop-down list provides a selection of variations for Video Scale processing, defining the actual range, as well as the way over-range data is handled.

Video Scale shrinks the actual LUT data to fit within the Video Scale range, with the overall LUT remaining full range.

Video Scale Clip Black re-scales the LUT into 64-940 range, with super-white extrapolated, and black clipped at 64.

Video Scale Pass Black re-scales the LUT into 64-940 range, with super-white and black extrapolated.

Video Scale Clip Black SW re-scales the LUT into 64-1023 range, with black clipped at 64.

Video Scale Pass Black SW re-scales the LUT into 64-1023 range, with black extrapolated.

Video Scale Sub Black re-scales the LUT into 0-940 range, with with super-white extrapolated.
The Apply button processes the selected Video Scale option, applying it to the selected LUT.
Undo and Redo can be used to undo any/all LUT manipulations made within LUT Tools, back to the starting position, and redo any/all undo's.
Append
The Append drop-down list provides a selection of LUT re-scaling processing, defining changes to be applied to the selected LUT, post the LUT.

Append concatenates the selected Scaling function after the LUT processing.
Lin -> Log adds a Linear to Cineon film Log conversion after the LUT.
Lin -> Vid adds a linear to Video gamma 2.2 conversion after the LUT.
Vid -> Log adds a Video gamma 2.2 to Log Cineon film Log conversion after the LUT.
Vid -> Lin adds a Video gamma 2.2 to Linear conversion after the LUT.
Log -> Vid adds a Cineon film Log to Video gamma 2.2 conversion after the LUT.
Log -> Lin adds a Cineon film Log to Linear conversion after the LUT.
1023 -> 64-940 adds full range to video range conversion after the LUT.
64-940 -> 1023 adds a video range to full range conversion after the LUT.
1023 -> 64-1023 adds a full range to video range, with super-white, conversion after the LUT.
64-1023 -> 1023 adds a video range, with super-white, to full range conversion after the LUT.
1023 -> 95-685 adds a full range to Cineon film range conversion after the LUT.
95-685 -> 1023 adds a Cineon film range to full range conversion after the LUT.
The Apply button processes the selected Video Scale option, applying it to the selected LUT.
Undo and Redo can be used to undo any/all LUT manipulations made within LUT Tools, back to the starting position, and redo any/all undo's.
Prepend
The Prepend drop-down list provides a selection of LUT re-scaling processing, defining changes to be applied to the selected LUT, pre the LUT.

Prepend concatenates the selected Scaling function before the LUT processing.
Lin -> Log adds a Linear to Cineon film Log conversion before the LUT.
Lin -> Vid adds a linear to Video gamma 2.2 conversion before the LUT.
Vid -> Log adds a Video gamma 2.2 to Log Cineon film Log conversion before the LUT.
Vid -> Lin adds a Video gamma 2.2 to Linear conversion before the LUT.
Log -> Vid adds a Cineon film Log to Video gamma 2.2 conversion before the LUT.
Log -> Lin adds a Cineon film Log to Linear conversion before the LUT.
1023 -> 64-940 adds full range to video range conversion before the LUT.
64-940 -> 1023 adds a video range to full range conversion before the LUT.
1023 -> 64-1023 adds a full range to video range, with super-white, conversion before the LUT.
64-1023 -> 1023 adds a video range, with super-white, to full range conversion before the LUT.
1023 -> 95-685 adds a full range to Cineon film range conversion before the LUT.
95-685 -> 1023 adds a Cineon film range to full range conversion before the LUT.
The Apply button processes the selected Video Scale option, applying it to the selected LUT.
Undo and Redo can be used to undo any/all LUT manipulations made within LUT Tools, back to the starting position, and redo any/all undo's.
Filters
The Filters tab provides options for LUT adjustments using a range of different filtering options.

Filters Options
The Filters options section provides access to all the tools and capabilities associated with the selected LUT Adjustment, Filters tabs.
(Click the Filters Tabs for specific information on each tab options.)
Reset
Reset resets all slider values to their defaults.
Apply
Apply processes the selected LUT Adjustment, applying to the selected LUT.
Unity Blend
The Unity Blend filter enables a selected range within a LUT to be set back to unity, ramping from the actual LUT values, to unity, and back to the LUT values.

The graphs show Unity Blend starts at 20%, is fully active between 35% and 60%, and ends at 70%.
The Function drop-down selects the slider being manipulated, which defines the area to be affected.
- Low Off defines point at which the filter starts to take effect
- Low On defines point at which the filter reaches 100% effect
- Hi On defines point at which the filter starts to reduce effect
- Hi Off defines point at which the filter ends
The Sliders and associated numerical value boxes define the adjustments to be applied.
Note: As with all ColourSpace Sliders, clicking to either side of the slider control will step the slider value by a predetermined amount, acting the same as Up/Down/Left/Right buttons.
The Sync Sliders tick box defines if the three RGB sliders are locked together, or operate independently.
The Apply button processes the defined settings, applying them to the selected LUT, and can be applied multiple times.
Reset resets all values to their defaults.
Undo and Redo can be used to undo any/all LUT manipulations made within LUT Tools, back to the starting position, and redo any/all undo's.


Mono Blend
The Mono Blend filter enables a selected range within a LUT to be set to being monochromatic B&W, ramping from the actual LUT values, to mono, and back to the LUT values.

The graphs show Mono Blend starts at 30%, is fully active between 35% and 50%, and ends at 80%.
The Function drop-down selects the slider being manipulated, which defines the area to be affected.
- Low Off defines point at which the filter starts to take effect
- Low On defines point at which the filter reaches 100% effect
- Hi On defines point at which the filter starts to reduce effect
- Hi Off defines point at which the filter ends
The Sliders and associated numerical value boxes define the adjustments to be applied.
Note: As with all ColourSpace Sliders, clicking to either side of the slider control will step the slider value by a predetermined amount, acting the same as Up/Down/Left/Right buttons.
The Sync Sliders tick box defines if the three RGB sliders are locked together, or operate independently.
The Apply button processes the defined settings, applying them to the selected LUT, and can be applied multiple times.
Reset resets all values to their defaults.
Undo and Redo can be used to undo any/all LUT manipulations made within LUT Tools, back to the starting position, and redo any/all undo's.


Grey Blend
The Grey Blend filter enables a selected range within a LUT to be colour normalised, maintaining the gamma/EOTF, both for the grey axis and the associated gamut, ramping from the actual LUT values, to the set values, and back to the LUT values.

The graphs show Grey Blend starts at 30%, is fully active between 35% and 50%, and ends at 75%.
The Function drop-down selects the slider being manipulated, which defines the area to be affected.
- Low Off defines point at which the filter starts to take effect
- Low On defines point at which the filter reaches 100% effect
- Hi On defines point at which the filter starts to reduce effect
- Hi Off defines point at which the filter ends
The Sliders and associated numerical value boxes define the adjustments to be applied.
Note: As with all ColourSpace Sliders, clicking to either side of the slider control will step the slider value by a predetermined amount, acting the same as Up/Down/Left/Right buttons.
The Sync Sliders tick box defines if the three RGB sliders are locked together, or operate independently.
The Apply button processes the defined settings, applying them to the selected LUT, and can be applied multiple times.
Reset resets all values to their defaults.
Undo and Redo can be used to undo any/all LUT manipulations made within LUT Tools, back to the starting position, and redo any/all undo's.


Axis Blend
The Axis Blend filter enables a selected range within the LUT's grey scale to be colour normalised, maintaining the gamma/EOTF, ramping from the actual LUT values, to the set values, and back to the LUT values, with a defined radius around the selected grey scale range.

The graphs show Axis Blend starts at 20%, is fully active between 30% and 70%, and ends at 80%, with a Blend value of 3.

The Function drop-down selects the slider being manipulated, which defines the area to be affected.
- Low Off defines point at which the filter starts to take effect
- Low On defines point at which the filter reaches 100% effect
- Hi On defines point at which the filter starts to reduce effect
- Hi Off defines point at which the filter ends
- Blend defines a radials around the grey axis, out to which the filter has a diminishing effect
The Sliders and associated numerical value boxes define the adjustments to be applied.
Note: As with all ColourSpace Sliders, clicking to either side of the slider control will step the slider value by a predetermined amount, acting the same as Up/Down/Left/Right buttons.
The Sync Sliders tick box defines if the three RGB sliders are locked together, or operate independently.
The Apply button processes the defined settings, applying them to the selected LUT, and can be applied multiple times.
Reset resets all values to their defaults.
Undo and Redo can be used to undo any/all LUT manipulations made within LUT Tools, back to the starting position, and redo any/all undo's.


Smooth
The Smooth filter enables a selected range within a LUT to be smoothed, ramping from the actual LUT values, to the set values, and back to the LUT values, with a defined radius around the selected colour range.

The graphs show Smooth starts at 0%, is fully active between 10% and 70%, and ends at 90%, with a Radius value of 5.

The Function drop-down selects the slider being manipulated, which defines the area to be affected.
- Low Off defines point at which the filter starts to take effect
- Low On defines point at which the filter reaches 100% effect
- Hi On defines point at which the filter starts to reduce effect
- Hi Off defines point at which the filter ends
- Radius defines a radials around the selected colour range, out to which the filter has a diminishing effect
The Sliders and associated numerical value boxes define the adjustments to be applied.
Note: As with all ColourSpace Sliders, clicking to either side of the slider control will step the slider value by a predetermined amount, acting the same as Up/Down/Left/Right buttons.
The Sync Sliders tick box defines if the three RGB sliders are locked together, or operate independently.
The Apply button processes the defined settings, applying them to the selected LUT, and can be applied multiple times.
Reset resets all values to their defaults.
Undo and Redo can be used to undo any/all LUT manipulations made within LUT Tools, back to the starting position, and redo any/all undo's.


Relax
The Relax filter enables a selected range within a LUT to merge from the defined Low to Hi settings, ramping from the actual LUT values, to the set values, and back to the LUT values.

The graphs show Relax starts at 35%, and ends at 63%, ramping between the two values.
The Function drop-down selects the slider being manipulated, which defines the range to be affected.
- Low On defines point at which the filter starts to take effect
- Hi Off defines point at which the filter ends
The Sliders and associated numerical value boxes define the adjustments to be applied.
Note: As with all ColourSpace Sliders, clicking to either side of the slider control will step the slider value by a predetermined amount, acting the same as Up/Down/Left/Right buttons.
The Sync Sliders tick box defines if the three RGB sliders are locked together, or operate independently.
The Apply button processes the defined settings, applying them to the selected LUT, and can be applied multiple times.
Reset resets all values to their defaults.
Undo and Redo can be used to undo any/all LUT manipulations made within LUT Tools, back to the starting position, and redo any/all undo's.


Colour
The Colour tab provides options for LUT adjustments using a range of different direct colour adjustment options.

Function
The Function area provides access to all the tools and capabilities associated with the Colour options.
(Click the individual drop-down entries for specific information on each option.)
Sliders
The Sliders area provides different slider functions depending on the Colour option selected.
(Click the individual drop-down entries for specific information on each option.)
Append
The Append option applies the selected Colour effect after the LUT, as a post-LUT process.
(Click the individual Colour function drop-down entries for specific information on each option.)
Prepend
The Prepend option applies the selected Colour effect before the LUT, as a pre-LUT process.
(Click the individual Colour function drop-down entries for specific information on each option.)
Lift
The colour Lift adjustment raises or lowers the RGB channels, from the low-lights, reducing in effect up to the high-lights. The selection of Append or Prepend defines if the Lift is applied before, or after, the LUT.

The graphs show how a Lift of R=0.1, G=0.0, B=-0.1 lifts or reduces the respected RGB channels in the low-lights, based on the selection of Append or Prepend.


The Sliders and associated numerical value boxes define the adjustments to be applied.
Note: As with all ColourSpace Sliders, clicking to either side of the slider control will step the slider value by a predetermined amount, acting the same as Up/Down/Left/Right buttons.
The Sync Sliders tick box defines if the three RGB sliders are locked together, or operate independently.
The Apply button processes the defined settings, applying them to the selected LUT, and can be applied multiple times.
Reset resets all values to their defaults.
Undo and Redo can be used to undo any/all LUT manipulations made within LUT Tools, back to the starting position, and redo any/all undo's.
Gain
The colour Gain adjustment raises or lowers the RGB channels, from the high-lights, reducing in effect down to the low-lights. The selection of Append or Prepend defines if the Gain is applied before, or after, the LUT.

The graphs show how a Gain of R=1.0, G=1.1, B=1.2 lifts the respected RGB channels in the high-lights, based on the selection of Append or Prepend.


The Sliders and associated numerical value boxes define the adjustments to be applied.
Note: As with all ColourSpace Sliders, clicking to either side of the slider control will step the slider value by a predetermined amount, acting the same as Up/Down/Left/Right buttons.
The Sync Sliders tick box defines if the three RGB sliders are locked together, or operate independently.
The Apply button processes the defined settings, applying them to the selected LUT, and can be applied multiple times.
Reset resets all values to their defaults.
Undo and Redo can be used to undo any/all LUT manipulations made within LUT Tools, back to the starting position, and redo any/all undo's.
Gamma
The colour Gamma adjustment raises or lowers the RGB channels in the mids, reducing in effect towards the low-lights and high-lights. The selection of Append or Prepend defines if the Gamma is applied before, or after, the LUT.

The graphs show how a Gain of R=0.9, G=1.0, B=1.1 lifts or drops the respected RGB channels in the mids, based on the selection of Append or Prepend.


The Sliders and associated numerical value boxes define the adjustments to be applied.
Note: As with all ColourSpace Sliders, clicking to either side of the slider control will step the slider value by a predetermined amount, acting the same as Up/Down/Left/Right buttons.
The Sync Sliders tick box defines if the three RGB sliders are locked together, or operate independently.
The Apply button processes the defined settings, applying them to the selected LUT, and can be applied multiple times.
Reset resets all values to their defaults.
Undo and Redo can be used to undo any/all LUT manipulations made within LUT Tools, back to the starting position, and redo any/all undo's.
HSL
The colour HSL adjustments provide independent control of Hue, Saturation, and Lightness. The selection of Append or Prepend defines if HSL adjustments are applied before, or after, the LUT.

The graphs show results for HSL adjustments of Hue=-0.5, Saturation=2.0, Lightness=0.85, based on the selection of Append or Prepend.


The Sliders and associated numerical value boxes define the adjustments to be applied.
Note: As with all ColourSpace Sliders, clicking to either side of the slider control will step the slider value by a predetermined amount, acting the same as Up/Down/Left/Right buttons.
The Sync Sliders tick box defines if the three RGB sliders are locked together, or operate independently.
The Apply button processes the defined settings, applying them to the selected LUT, and can be applied multiple times.
Reset resets all values to their defaults.
Undo and Redo can be used to undo any/all LUT manipulations made within LUT Tools, back to the starting position, and redo any/all undo's.
Printer Lights
The colour Printer Lights adjustments provide traditional RGB printer light control. The selection of Append or Prepend defines if HSL adjustments are applied before, or after, the LUT.

The graphs show results for Printer Lights adjustments of R=-5.0, G=1.5, B=-10.0, based on the selection of Append or Prepend.


The Sliders and associated numerical value boxes define the adjustments to be applied.
Note: As with all ColourSpace Sliders, clicking to either side of the slider control will step the slider value by a predetermined amount, acting the same as Up/Down/Left/Right buttons.
The Sync Sliders tick box defines if the three RGB sliders are locked together, or operate independently.
The Apply button processes the defined settings, applying them to the selected LUT, and can be applied multiple times.
Reset resets all values to their defaults.
Undo and Redo can be used to undo any/all LUT manipulations made within LUT Tools, back to the starting position, and redo any/all undo's.
Maths
The Maths tab provides options for advanced LUT adjustments using a range of different direct selection adjustment options, plus mathematical formulas that can be applied independently to each RGB channel.

Maths Equations
The Equations options opens a menu into which mathematical calculations and arguments can be entered, allowing direct LUT manipulation, as either Append or Prepend operation.

There are 3 separate text boxes, and the operation of each is identical. The default startup state is:
- R= R
- G= G
- B= B
Which will do nothing, as output equals input.
For more information see the Maths Equations page.
Function
The Function area provides access to all the tools and capabilities associated with the Maths options.
The first drop-down selects the specific Maths function, while the second drop-down becomes active when the selection of a second LUT is required for the Maths function in use.
(Click the individual drop-down entries for specific information on each option.)
Invert
Invert performs a mathematical invert on the selected LUT.
(Inverting 3D LUTs will rarely generate perfect results, due to the associated complexities of the original LUT.)
Add
The Add option concatenates the selected LUT with a second LUT, selected via the associated drop-down.
For more information see the Separate LUT Components page.

The graphs show how the Add result will change with the concatenation order, comparing starting with the film_emulation LUT first and Adding the Rec709_DCI-P3-D65 LUT to it, and then the other way round.
(The second LUT is always concatenated as an append function to the main LUT.)


The Apply button processes the defined settings, applying them to the selected LUT, and can be applied multiple times.
Undo and Redo can be used to undo any/all LUT manipulations made within LUT Tools, back to the starting position, and redo any/all undo's.
Subtract
The Subtract option concatenates the selected LUT with a second LUT, selected via the associated drop-down.
The second LUT is always concatenated as an append function to the main LUT.

The graphs show how the Subtract result will change with the concatenation order.


The Apply button processes the defined settings, applying them to the selected LUT, and can be applied multiple times.
Undo and Redo can be used to undo any/all LUT manipulations made within LUT Tools, back to the starting position, and redo any/all undo's.
Split (1D + 3D)
The Split (1D + 3D) function separates the selected LUT into its two constituent parts, generating a new 1D LUT (held as a 3D LUT) containing just the 1D component of the original LUT, and a new 3D LUT containing the 3D volumetric component.
For more information see the Separate LUT Components page.
The Apply button processes the defined settings, applying them to the selected LUT, and can be applied multiple times.
Undo and Redo can be used to undo any/all LUT manipulations made within LUT Tools, back to the starting position, and redo any/all undo's.
Grey Axis Replace
The Grey Axis Replace function enables the grey axis of the present LUT to be replaced by the grey axis from any other LUT. If None is selected as the alternative LUT (or Default Unity) the grey axis in the present LUT will be replace with unity values.
It is important to realise that replacing the grey axis is not the same as replacing the 1D component of a LUT!
For more information see the Separate LUT Components page.
The Apply button processes the defined settings, applying them to the selected LUT, and can be applied multiple times.
Undo and Redo can be used to undo any/all LUT manipulations made within LUT Tools, back to the starting position, and redo any/all undo's.
Equations
The Equations option enables the writing of mathematical formulas that can be applied to each channel of the selected LUT.
The selection of Append or Prepend defines the position of the formula to be applied before or after the LUT.
The graphs show how the Equation result will change based on the selection of Append or Prepend.
(The Equation (R*0.28)+(G*0.7)+(B*0.02) produces a weighted monochrome image.)


The Apply button processes the defined settings, applying them to the selected LUT, and can be applied multiple times.
Undo and Redo can be used to undo any/all LUT manipulations made within LUT Tools, back to the starting position, and redo any/all undo's.
See Maths Equations page for detailed information on using Equations.
Reset Eqns
Reset Eqns resets any entered equations.
Export & Import
The Export & Import buttons allow and equations to saved externally and re-imported as needed.
ASC CDL
The ASC CDL tab provides a range of controls to adjust an existing LUT, or generate a new LUT, using standard CDL tools, including Slope, Offset, Power & Saturation, as well as the ability to extract CDL data from an exiting LUT for export as a CDLfile.

ASC CDL Options
The ASC CDL options section provides access to all the tools and capabilities associated with the different CDL adjustments.
(Click the ASC CDL Tabs for specific information on each tab options.)
Slope
The Slope option alters the selected LUT as defined by the sliders.
The selection of Append or Prepend defines the location of the CDL change to be applied, before or after the LUT.

The graphs show the results of Slope values set to R=1.25, G=1.0, and B=0.9, first with Append and then Prepend, with all other CDL setting set to their default values.


The Sliders and associated numerical value boxes define the adjustments to be applied.
Note: As with all ColourSpace Sliders, clicking to either side of the slider control will step the slider value by a predetermined amount, acting the same as Up/Down/Left/Right buttons.
The Apply button processes all the defined CDL settings simultaneously, applying them to the selected LUT, and can be applied multiple times.
Reset resets all CDL values to their defaults.
Undo and Redo can be used to undo any/all LUT manipulations made within LUT Tools, back to the starting position, and redo any/all undo's.
Offset
The Offset option alters the selected LUT as defined by the sliders.
The selection of Append or Prepend defines the location of the CDL change, to be applied before or after the LUT.

The graphs show the results of Offset values set to R=0.1, G=0.0, and B=-0.1, first with Append and then Prepend, with all other CDL setting set to their default values.


The Sliders and associated numerical value boxes define the adjustments to be applied.
Note: As with all ColourSpace Sliders, clicking to either side of the slider control will step the slider value by a predetermined amount, acting the same as Up/Down/Left/Right buttons.
The Apply button processes all the defined CDL settings simultaneously, applying them to the selected LUT, and can be applied multiple times.
Reset resets all CDL values to their defaults.
Undo and Redo can be used to undo any/all LUT manipulations made within LUT Tools, back to the starting position, and redo any/all undo's.
Power
The Power option alters the selected LUT as defined by the sliders.
The selection of Append or Prepend defines the location of the CDL change, to be applied before or after the LUT.

The graphs show the results of Power values set to R=0.7, G=1.0, and B=1.5, first with Append and then Prepend, with all other CDL setting set to their default values.


The Sliders and associated numerical value boxes define the adjustments to be applied.
Note: As with all ColourSpace Sliders, clicking to either side of the slider control will step the slider value by a predetermined amount, acting the same as Up/Down/Left/Right buttons.
The Apply button processes all the defined CDL settings simultaneously, applying them to the selected LUT, and can be applied multiple times.
Reset resets all CDL values to their defaults.
Undo and Redo can be used to undo any/all LUT manipulations made within LUT Tools, back to the starting position, and redo any/all undo's.
Saturation
The Saturation option alters the selected LUT as defined by the slider.
The selection of Append or Prepend defines the location of the CDL change, to be applied before or after the LUT.

The graphs show the results of Saturation value set 1.75, first with Append and then Prepend, with all other CDL setting set to their default values.


The Sliders and associated numerical value boxes define the adjustments to be applied.
Note: As with all ColourSpace Sliders, clicking to either side of the slider control will step the slider value by a predetermined amount, acting the same as Up/Down/Left/Right buttons.
The Apply button processes all the defined CDL settings simultaneously, applying them to the selected LUT, and can be applied multiple times.
Reset resets all CDL values to their defaults.
Undo and Redo can be used to undo any/all LUT manipulations made within LUT Tools, back to the starting position, and redo any/all undo's.
Extract
The Extract option extracts CDL settings from the LUT selected via the drop-down list.
After Extraction the Slope, Offset, Power and Saturation sliders will be populated with the extracted values, and can be applied to any LUT.
The Extract From button performs the extraction, and the info pop-up will show the relative accuracy of the extraction.
The more complex the LUT the less accurate the extracted CDL data will be.

The graphs show the results of Extract for the selected LUT.
The Apply button processes all the defined ASC CDL settings, applying them to the selected LUT, and can be applied multiple times.
Reset resets all ASC CDL values to their defaults.
Undo and Redo can be used to undo any/all LUT manipulations made within LUT Tools, back to the starting position, and redo any/all undo's.


Import CDL
The Import CDL button opens a navigation window to allow external CDL files to be imported, and applies the CDL data to a new LUT, or multiple LUTs, depending on the CDL file imported.
CDL files can be Colour Decision List files (.cdl), Colour Correction Collection files (.ccc), or Colour Correction files (.cc).
Export CCC
The Export CCC button exports the present Slope, Offset, Power, and Saturation values as a CDL file.
ARRI Look
The ARRI Look tab provides the ability to generate a LUT from an ARRI Look file, as well as extract an ARRI Look from a selected LUT.

ARRI Look
The ARRI Look options .


The various options configure the settings for Import and Export, as defined.
The Import and Export options set global parameters, while Import Only, and Export Only, set specific parameters for the defined import/export operation.
The Import button opens a navigation window to allow external ARRI Look files to be imported, and applied to the selected LUT.
The Export button extracts an ARRI Look from the selected LUT, using a combination of Saturation, Printer Lights, CDL controls (Slope, Offset, and Power), and mono free-form curves for each RGB colour channel, and exports as a .xml file.
Undo and Redo can be used to undo any/all LUT manipulations made within LUT Tools, back to the starting position, and redo any/all undo's.


Import
The Import button opens a navigation window to allow external ARRI Look files to be imported, and applied the selected LUT.
The ARRI Look file is applied to the selected LUT based on the ARRI Look options settings.
Export
The Export button extracts an ARRI Look from the selected LUT, using a combination of Saturation, Printer Lights, CDL controls (Slope, Offset, and Power), and mono free-form curves for each RGB colour channel, and exports as a .xml file.
ACES
The ACES tab enables LUT generation from ACES CTL file imports, as well as the extraction of ACES CTL files from existing LUTs. Additionally, LUTs can be generated from ACES CLF/CTF files, as well ACES CLF/CTF files generated from existing LUTs.

ACES CTL
The ACES ctl drop-down selection defines the import/export functions to operate with ACES Colour Transform Language (.ctl) files.
ACES Use
To use ACES with ColourSpace the desired ACES version will need to be installed on the same PC as ColourSpace.
(Note: Presently ACES v2 is not supported - only the previous v1.3.1 and earlier versions are supported.)
Extract the ACES .zip file, and note the location of the folder that contains the ACESlib.xxx.ctl files, within the .ctl folder.
Set an Environment Variable on the ColourSpace PC to point to the location of the above folder.
(Click This PC, select Properties, Advanced system settings, Environment Variables, and set a new variable CTL_MODULE_PATH, and point to the location of the folder defined above.)
For more information see the ColourSpace & ACES User Guide.
ACES CLF
The ACES clf drop-down selection defines the import/export functions to operate with ACES Common LUT Format (.clf) files.
(The .ctf file format is an Autodesk variation on the ACES .clf format)
Import
The Import button opens a navigation window to allow external ACES ctl/clf files to be imported, and applied the selected LUT.
ACES ctl Import
Importing and processing ACES ctl files into a LUT is based on the alphabetical order of the ctl files, and needs the IDT first, followed by RRT, and ODT.

Prefixing the ctl files with incremental numbering - 001-IDTxxx, 002-RRTxxx, 003-ODTxxx - can be used to correctly sort the import ordering.
Export
The Export button exports the selected LUT as an ACES clf/ctf file.
Reporting
The Reporting option enables either pre-built, or user generated templates, to be used to define workflows for display profile reports. A selection of pre-built templates can be downloaded via the Customer Downloads page, and can be used as the basis for additional template design. The download also includes a PDF detailing the Profile Tokens and Markup Language used within Reports.
(Back to Main Menu)
Reports
When initially opened, the Reports window will be configured with the Default workflow, with no profile data loaded.

Config
The Config options are used to define the Layout template in use, and provide controls for template management.

The Layout template drop-down enables the selection of any previously saved layout templates, as well as a backup, if one has been auto-generated.

The Open Layout button will apply the layout template selected from the Layouts drop-down list.

The Delete Layout button deletes the selected layout template.
(The Default layout template cannot be deleted, and will be cleared instead.)

The Save Layout button will save any changes to the presently selected layout template.

The New Layout button will start a new, initially blank, layout template.

The Import Layout button enables navigation to report layout templates previously exported to external storage.

The Export Layout button enables report layout templates to be exported and saved to external storage.
The Layout template options can be used in various combinations, for example to save updated layout templates without overwriting the original template.
- Open an existing template, or having generated one from new, save it
- Make the desired changes to the existing layout template
- Select the New Layout button, and enter a new layout template name, and click OK
- From the Layout drop-down list, select the new layout template name
- Use the Save Layout button to save the presently active layout template, with its changes, into the new layout template
(A prompt will appear warning you you are overwriting the new layout template with the settings from the presently active template, which is what you want to do)
The Default layout template is continuously updated automatically, and so always holds the latest layout template changes.
Report
The Report options are used to build the Report, based on selected ColourSpace profiles, adding layout blocks and user test as required.

The Report Blocks drop-down enables the selection of different template layout blocks, including images (Logos), Text, Graphs, Horizontal Layout, and Divider blocks.
Once a Block has been selected, the Add button is used to add the selected block into the Layout Editor.
The Preview button will display the created Report in the preview window.
If the Report includes a Gamut Coverage value, a pop-up will show Gamut Coverage is being processed before the Report is populated.
The Cancel button within the pop-up can be used to cancel the gamut coverage calculation, if the profile has issues causing extended processing. Cancelling can take up to 30 seconds or so to complete.
The Save PDF button will save the defined Report as a PDF document.
Layout in editor
The Layout in editor text line show the presently active Layout, as well as a version number for the Layout.
The Version Number can be manually edited in the exported .rpt file, using a text editor.
Search for text string user_version=0, and modify the value to any whole integer between 0-9999, and can be used to verify the Report Template in use.
Note: The Version Number can be used in conjunction with a Read Only option for organisational control of Reports.
Block Layout Tree
The Block Layout Tree shows the structure of the various report layout blocks in use.

Selecting any specific block icon will open the associated editor for that specific Block.
Each Block type has unique options.
 Selection of the profile(s) to be used, as well as global Configurations
 Insert an image into the report, for example Company Logo
 Define a Horizontal set of blocks, of any type
 Define a Vertical set of blocks, of any type
 Insert a Text block, either for direct text entry, or automated data recall
 Insert a Divider/Spacer, Page Break, or Line
 Insert a Graph
After selecting a Layout Block icon, the Block Editor options to the right if the tree will show the available controls and options for each selected block type, such as the Font to be used for Text blocks, etc.
(Click on the Block Editor area for more information.)
Selected blocks can be dragged to other positions within the tree, with the dragged block being attached to the bottom of the block it is dragged to.
(To drag a block into the main trunk of the tree, when Horizontal Blocks are in use, drag to the Main Report Block at the top, and the block will be added at the bottom the main tree trunk. The Up/Down icons can then be used to position the block elsewhere within the tree.)
Block Editor
The Block Editor area defines different options for the selected Block type.

The ![]() Report Block Editor is where the required profile(s) are selected, as well as general Configuration settings defined.
Report Block Editor is where the required profile(s) are selected, as well as general Configuration settings defined.
The initial option is a Report Name box, enabling a user defined name to be entered for the Report being generated.
Below the name box, each of the Profile tabs have a drop-down to enable selection of the desired profile, from which the report data will be extracted. Two profile tabes are provided by default, while higher ColourSpace license levels can set a user defined Profile count up to a maximum of 9, for multiple calibration comparisons, or combining data from multiple profiles into a single Report.
With a Profile tab active, and a profile selected from the drop-down list, the associated profile data sections are populated with the available Profile data. Light Green sections show the populated data is as from the profile, while Light Red shows the data has been manually changed, and White shows options that have not been automatically populated from the profile data, and can be manually added.
There are four distinct profile data areas.
- Profile: Including Creation Date, and Notes
- Target: Shows the target colour space data as set when the profile was saved
- Settings: Lists various ColourSpace settings as defined when the profile was saved
- Probe: Displays all probe settings as configured when the profile was saved

The Setup tab can be used to set global configurations for the report, including page setup, dE colour coding & Min/Max Threshold values, Graphics setup, including Graph background grey scale value, as well as various 2D graph line & marker sizes, as well as a Show block boundary option that assists in designing new Template layouts.
The Show block boundary option highlights each block boundary in three different colours - Red for Auto Size blocks; Brown for Fixed Size, and Green for Borders.
The User version entry shows an optional Version Number for a given layout.
The Version Number has to be manually edited in the exported .rpt file, using a text editor. Search for text string user_version=0, and modify the value to any whole integer between 0-9999, and can be used to verify the Report Template in use.
The Read only entry shows if the specific layout can be modified, or not.
The Read Only option has to be manually edited in the exported .rpt file, using a text editor. Search for text string read_only=0, and set the value to 1 to make Read only, which will prevent the Report Template being user modified. Used in conjunction with User version, can be used to restrict the Report Templates used within a wider operation, and maintain version history.
The User tab enables user defined Tokens to be configured, allowing relative information to be automatically inserted into Reports, using the {U_xxxx} Token format within the Template Layout.
Duplicate entries can be used, for example different Calibrator names, with the associated Radio Button selecting the option to use within the Report.

The Template Layout Token is case sensitive, so {U_company} is not the same as {U_Company}, and must match the character case used when defining the User entry - company vs Company, for example.
The  and
and  icons Add and Delete User entries. The
  and
and  icons Move Up and Move Down User entries.
For all Blocks below the main header Report Block, there is an initial row of Block Edit Icons.

The first three Alignment icons position the selected block Left, Centre, or Right (when Block Size fixed is set to True), while the next four Edit icons move the selected block Up or Down the layout tree, or Clone or Delete it.
The next option is a Name box, enabling a user defined name to be displayed in the Layout Tree, for quick identification of any given block.

The ![]() Image Block Editor enables the selection of any image, for example a company logo.
Image Block Editor enables the selection of any image, for example a company logo.
Layout options below the selected image proved a range of settings, including image size and borders.

The ![]() Graph Block Editor enables the selection of any ColourSpace graph for insertion into the report.
Graph Block Editor enables the selection of any ColourSpace graph for insertion into the report.
The Type drop-down list enables the desired graph type to be selected, from all the graph types available within ColourSpace.
The graphs can be zoomed, positioned, and with the 3D graphs, rotated, as with the main graphs within ColourSpace. The Lock tick box will lock the selected graph type, enabling further use of the same graph type to initially open with the same settings.
The Graph Options Hamburger button will appear, and provides access to graph specific options, such as for Absolute plotting, just as with the graphs within the main Profiling window.
Layout options below the selected graph proved a range of settings for the selected graph, via drop-down selections, and text or value entry.
There are five distinct Graph layout areas.
- Profile source: Selects the source profile to be used for the graph
- Display filters: Defines what data to display on the graph
(Including Custom Filters for higher ColourSpace license levels) - dE filters: Sets dE filtering to be applied to the displayed graph data
- Graph position: Displays the values for size, position, rotation as set for the graph
(The values can also be directly edited) - Layout: Enables the default graph layout parameters to be changed, including block size and borders

The ![]() Text Block Editor enables data to be extracted from the profile, and displayed in text form, as well as user text to be added.
Text Block Editor enables data to be extracted from the profile, and displayed in text form, as well as user text to be added.
For data extracted from the ColourSpace profile, Reports uses Profile Tokens to define the data to be inserted into the report. Each Token is defined by being help within curly brackets - {xxx_xx_xxxx}.
For additional text formatting, a Markup Language, based on a sub-set of HTML (similar to XML), is used.
A separate Reporting Markup document, explaining the various Profile Tokens and Markup Language options, is provided via the Customer Downloads page of the website.
There are two Text layout adjustment areas.
- Font: Defines the font type to use from the available options, and text size
Note: The Liberation fonts contain all special and accented characters - Layout: Enables the default text area layout parameters to be changed, including block size and borders
User fonts can also be used within Reports by adding the required font files into a User folder within the Fonts folder.
(Note: The font files must be processed for use within Reports. Contact Light Illusion for assistance with this.)
With the Layout options, Sized Fixed can be True or False. With False selected the Text Block will Auto Size to its content, making layout design a lot simpler.
The Render Size values are also very helpful, as they report the overall size of the block, including borders, greatly assisting with block alignment settings.
The ![]() Divider Editor enables dividers, page breaks, and lines to be added into any template layout.
Divider Editor enables dividers, page breaks, and lines to be added into any template layout.
There are two Divider layout adjustment areas.
- Divider: Defines type of divider to be used
- Layout: Enables the default Divider area layout parameters to be changed, including block size and borders
The ![]() Horizontal icon has no associated Block Editor, as it is used to link Text, Graph, and Image blocks into Horizontal layout rows.
Horizontal icon has no associated Block Editor, as it is used to link Text, Graph, and Image blocks into Horizontal layout rows.
Preview
The Preview Window displays the Report layout, and is updated every time the Preview button is pressed.
The Print icon will use any attached printers to print the report, including software as well as physical printers.
Page Select
The Page Select icons will toggle through the page of the report, or jump directly to the page number entered.
Zoom
The Zoom icons will zoom the report preview in or out, or jump directly to the zoom value sleeted via the drop-down.
Rotate
The Rotate icon will rotate the report preview on 90° steps clockwise.
Fit Page
The Fit Page icon will fit the report to show one full page within the preview window, preventing an cropping of the page.
Fit Page
The Fit Width icon will fit the report to the width of the preview window, cropping the page bottom if necessary.