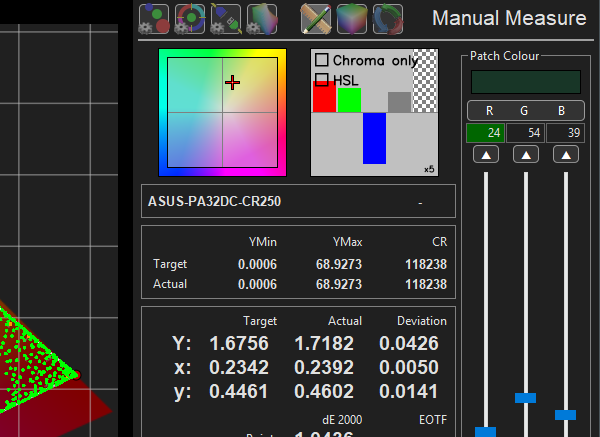
When performing Manual Measure operations the Zoom & Bars Widgets provide additional indication of the measured colour & luminance error relative to the target colour space, complimenting the main graphs.
The Zoom widget colour orientation follows that of the last CIE graph used, be that CIE xy, or CIE uv.
Zoom & Bars Widgets
The Zoom & Bars Widgets provide an additional indication of any measured colour error relative to the target colour space, complimenting the main graphs, with the zoom level of the Bars widget automatically scaled depending on the relative size of the underlying colour error.

The Zoom Widget shows a selected, zoomed, area of the active 2D CIE xy or CIE uv charts, centralised on the present colour being measured. Selecting the 2D xy or uv CIE main graphs will alter the widget orientation and colour background to match.
The cross's offset from the centre of the zoom widget shows the colour error, relative to the target colour space.
The Bars Widget is a bit more complex, and in its basic form shows any colour error based on R, G, and B values.
The actual error representation in the default RGB mode shows any error as a combination of colour/gamut and luminance, with the 4th bar showing luminance independently, and the 5th, chequered, bar showing the dE error.
The displayed error is also relative to the Min/Max brightness of the screen.
For example, colour only errors closer to black will be shown as being a smaller error than the same colour error near white, with any errors at black being infinitesimally small, as can be seen with the XYZ values for any measured point.
In addition to the height of the bars defining the colour error, the intensity of the bar's colour increases with a greater error value, with the Bars Widget auto zooming resolution, depending on the measured error value.
Any Zoom value is shown bottom right of the widget.
Hovering over the Bars Widget displays two additional options that change the operation of the widget - Chroma Only, and HSL.
Chroma Only removes the effect of luminance from the R, G and B bars, displaying just the gamut error, with the luminance error still being displayed via the luma bar, plus the dE bar. The removal of the effect of luminance means the bars will show a great visual error with Chroma Only enabled for a given measurement, much like dE values. The following image shows the same point selected as above, but for Chroma Only.

The HSL option changes the widget to display Hue, Saturation, and Luminance, along with the dE bar, using an RGB to HSL conversion, based on the original RGB error.

In HSL mode, the first bar shows the Hue error, with a negative bar representing a counter clockwise error, and a positive bar a clockwise error. The second bar shows a saturation error, with the luma and dE bars operating as normal.
Note: As the widget displays HSL based on the original RGB error the suggested hue rotation is not necessarily an exact representation of the underlying error.
In addition to the height of the bars defining the colour error, the intensity of the bar's colour increases with a greater error value, as well as showing the colour being adjusted.