With higher ColourSpace license levels the 1D & 2D graphs, for both Profiles and LUTs, have an interactive Point Adjust capability, enabling point values to be directly edited from the graphs.
The Point Adjust ability enables profile measurement errors to be corrected, either before a LUT is generated - correcting the actual profile measurements - or correcting a LUT generated from a profile with measurement errors.
Point Adjust
Profile errors are usually associated with probe miss-readings, or unexpected display variations. Usually a re-read of the patches that show errors can fix the issue, but sometimes that will not work, such as when trying to read very low-light values. Being able to correct such errors can help in generating more precise calibration LUTs.
When the mouse is hovered over the graph a  Graph Options Hamburger button will appear, and provides access to graph specific options, such as for Point Adjust and Absolute plotting.

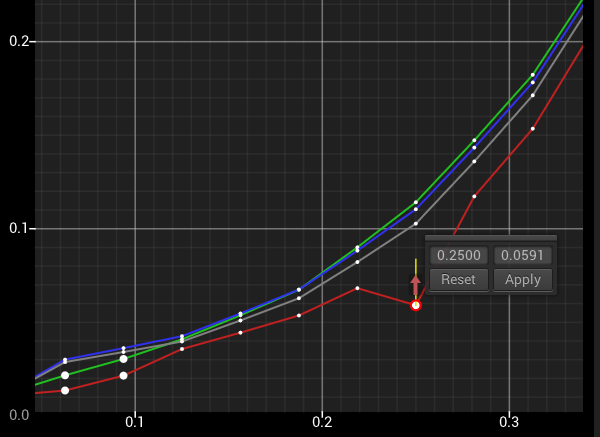
If the Show/Enable Point move options have been enabled via additional Graph Options, after a point has been selected via a Double Left Click, a floating values window will be opened. After a point has been selected, hovering over it will display Point Adjust arrows, enabling the selected point to be manually adjusted, as well as allowing the values in the floating window to be directly edited.
Note: Editing points within Profiling via Point Adjust is not possible if Probe Matching is active.
As a point is adjusted, a yellow Tangent Line will show the deviation from the point's original location. Reset and Apply buttons also become enabled when a point has been repositioned.
If multiple points are adjusted, but not Applied, the point's dot marker will be shown larger than normal to signify an adjustment has been made. All individual adjusted points need to be Applied before the profile is Saved.
Note: When Apply is actioned is is likely other components with the graph will change, due to value interaction, as well as affecting other graphs, such as changes to grey scale points via the RGB Balance and CIE graphs altering EOTF.
Additionally, due to the complex nature of the RGB Balance graph, using the CIE graphs to alter grey scale values is recommended.
Any changes to a point are mapped live across all associated graphs, such that changes to grey scale points made in the CIE graphs will be mirrored within the associated RGB Balance, EOTF, RGB Separation graphs, etc. Using the pop-out floating graphs capability means all associated graphs can be viewed simultaneously while making Point Adjust changes.
Repeated double right clicking of a given point will cycle through all three RGB colours, should they all have the same coordinates, and will bring to the front the selected colour channel's graph line in 1D graphs.


The adjustment arrows are also colour-coded to channel being altered for 1D graphs, and show yellow for the 2D CIE graphs.
The floating Point Adjust values window can be repositioned using the floating window's top bar, and if placed back over its active point will re-dock back to its default location.
The Profile Graphs with Point Adjust capability are those that directly show measured data:
- CIE xy
- CIE uv
- EOTF
- Dif EOTF
- RGB Balance
- Drift
Within LUT Generation, the 1D LUT graph also has Point Adjust capability, enabling errors to be corrected after a LUT has been generated.

As with Profile graphs, if the Show/Enable Point move options have been enabled via the additional Graph Options a Double Left Click on any point in the 1D graph selects the point, and opens a floating values window. After a point has been selected, hovering over it will display Point Adjust arrows, enabling the selected point to be manually adjusted, as well as allowing the values in the floating window to be directly edited.
As a point is adjusted, a yellow Tangent Line will show the deviation from the point's original location. Reset and Apply buttons also become enabled when a point has been repositioned.
If multiple points are adjusted, but not Applied, the point's dot marker will be shown larger than normal to signify an adjustment has been made. All individual adjusted points need to be Applied before a LUT is Saved.
Repeated double right clicking of a given point will cycle through all three RGB colours, should they all have the same coordinates, and will bring to the front the selected colour channel's graph line. The adjustment arrows are also colour-coded to channel being altered.
The floating Point Adjust values window can be repositioned using the floating window's top bar, and if placed back over its active point will re-dock back to its default location.


