Using any display's in-built Colour Management System (CMS) adjustment controls, ColourSpace can calibrate any home TV as accurately as is possible through the use of user defined patch sets.
The ability to accurately define the required patch sets based on a TV's control points is key to gaining accurate calibration results.
TV Calibration Patch Sets
TV CMS adjustment patch sets
Manual TV calibration is greatly enhanced within ColourSpace by the ability to import patch sets specifically tailored to match home TV's internal CMS control points, regardless of the patches needed, and loaded as .csv file Preset Patch Lists.
For more information see the Patch Scale & Resolution page.
For some TV models, such as Sony and LG, users with access to Customer Downloads can download example .csv patch lists with the correct control points already defined.
But, it is extremely simple for any ColourSpace user to define the correct patch themselves.
Defining Adjustment Point Values
When the correct patch values for each Multi-Point adjustment are not known, or to verify the manufacturer stated values are correct, they can be defined by using single lsb step preset patch lists, with min/max values set for each adjustment point, as follows:
- Starting with the 100% adjustment point, set only the Green channel to its max value
- Set the next lower adjustment point to have the Blue channel set to its min value
- Set the next lower adjustment point to have the Red channel set to its max value
- Set the next lower adjustment point to have the Green channel set to its min value
- Repeat for all available adjustment points such that one point will have one channel at max and the next will have it to min...
When complete, profile using a patch set defined with the required bit depth, and correct range, be that Full, Legal, or Extended as needed by the TV, in single bit steps
For example, for Legal Range 10-bit:
- 64,64,64
- 65,65,65
- 66,66,66
- 67,67,67
- ...
- 940,940,940
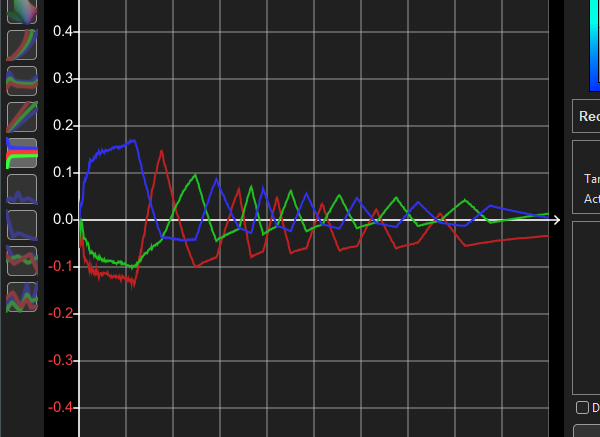
The resulting profile will show a zig-zag pattern in the RGB Balance graph, with each peak/trough defining the correct patch value for each adjustment point, as in the example below.

As necessary, the graphs can be zoomed into and the peak/trough values defined.


